

Oaktree Asset-Backed Income Fund I (OABIX)
10.34
0.00 (0.00%)
USD |
Jun 09 2026
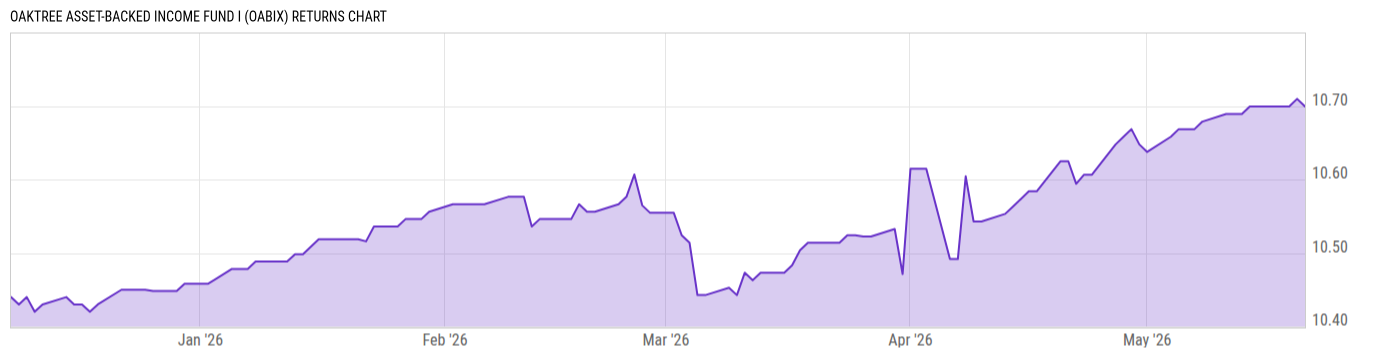
Returns Chart
Key Stats
| Net Expense Ratio | Total Assets Under Management | Weighted Average Dividend Yield | Turnover Ratio (Generic) |
|---|---|---|---|
| 6.69% | 385.68M | -- | -- |
| 1 Year Fund Level Flows | 1 Year Total Returns (Daily) | Annualized Total Returns Since Inception (Daily) | Max Drawdown (Since Inception) |
| -- | -- |
Basic Info
| Investment Strategy | |
| The Fund seeks to provide current income and capital appreciation. Under normal market conditions, the Fund will invests at least 80% of its net assets (plus the amount of any borrowings for investment purposes) in asset-backed finance (ABF Investments) throughout the world, including the United States. |
| General | |
| Security Type | Unlisted Closed-End Fund |
| Equity Style | -- |
| Broad Asset Class | Taxable Bond |
| Broad Category | Fixed Income |
| Global Peer Group | Bond Global USD |
| Peer Group | Global Income Funds |
| Global Macro | Bond Global |
| US Macro | World Income Funds |
| YCharts Categorization | -- |
| YCharts Benchmark | -- |
| Prospectus Objective | Global Income Funds |
| Fund Owner Firm Name | Oaktree |
| Broad Asset Class Benchmark Index | |
| ^BBUSATR | 100.0% |
Net Fund Flows Versus Peer Group
1 Month
% Rank:
--
-35.14M
Peer Group Low
294.12M
Peer Group High
1 Year
% Rank:
--
-1.119B
Peer Group Low
1.537B
Peer Group High
3 Months
% Rank:
--
-325.40M
Peer Group Low
571.67M
Peer Group High
3 Years
% Rank:
--
-2.484B
Peer Group Low
2.741B
Peer Group High
6 Months
% Rank:
--
-731.75M
Peer Group Low
783.93M
Peer Group High
5 Years
% Rank:
--
-7.808B
Peer Group Low
3.313B
Peer Group High
YTD
% Rank:
--
-469.47M
Peer Group Low
717.27M
Peer Group High
10 Years
% Rank:
--
-47.03B
Peer Group Low
4.548B
Peer Group High
Date Unavailable
Risk
Performance Versus Peer Group
Annual Total Returns Versus Peers
As of June 10, 2026.
Asset Allocation
As of December 31, 2025.
| Type | % Net |
|---|---|
| Cash | 4.59% |
| Stock | 45.77% |
| Bond | 63.93% |
| Convertible | 0.00% |
| Preferred | 0.00% |
| Other | -14.30% |
Top 10 Holdings
| Name | % Weight | Price | % Change |
|---|---|---|---|
|
Midland States Bank
|
25.13% | -- | -- |
| First American Treasury Obligations Fund X | 14.24% | 1.00 | 0.00% |
|
BP LPI LLC FRN 22-Dec-2031
|
9.48% | -- | -- |
|
Time Home Investment Co
|
7.02% | -- | -- |
|
Santander Bank NA
|
5.69% | -- | -- |
|
Guggenheim Investments Private Debt Fund IV Unlevered Rated Note Feeder LLC FRN 17-Jan-2039
|
4.59% | -- | -- |
|
VCI Asset Holdings 2 LLC FRN 06-Feb-2031
|
4.03% | -- | -- |
|
GASL Bermuda 1 Ltd FRN 15-Dec-2030
|
2.75% | -- | -- |
|
Oaktree Asset-Backed Income Fund Inc
|
2.65% | -- | -- |
|
Project Hudson/Deutsche Pfandbriefbank AG CLN
|
2.59% | -- | -- |
Fees & Availability
| Fees | |
| Actual 12B-1 Fee | -- |
| Actual Management Fee | 1.25% |
| Administration Fee | -- |
| Maximum Front Load | -- |
| Maximum Deferred Load | -- |
| Maximum Redemption Fee | -- |
| General Availability | |
| Available for Insurance Product | No |
| Available for RRSP | No |
| Purchase Details | |
| Open to New Investors |
|
| Minimum Initial Investment | 1.00M None |
| Minimum Subsequent Investment | 0.00 None |
Basic Info
| Investment Strategy | |
| The Fund seeks to provide current income and capital appreciation. Under normal market conditions, the Fund will invests at least 80% of its net assets (plus the amount of any borrowings for investment purposes) in asset-backed finance (ABF Investments) throughout the world, including the United States. |
| General | |
| Security Type | Unlisted Closed-End Fund |
| Equity Style | -- |
| Broad Asset Class | Taxable Bond |
| Broad Category | Fixed Income |
| Global Peer Group | Bond Global USD |
| Peer Group | Global Income Funds |
| Global Macro | Bond Global |
| US Macro | World Income Funds |
| YCharts Categorization | -- |
| YCharts Benchmark | -- |
| Prospectus Objective | Global Income Funds |
| Fund Owner Firm Name | Oaktree |
| Broad Asset Class Benchmark Index | |
| ^BBUSATR | 100.0% |
Fundamentals
| General | |
| Distribution Yield | -- |
| Dividend Yield TTM (6-8-26) | 0.00% |
| 30-Day SEC Yield | -- |
| 7-Day SEC Yield | -- |
| Number of Holdings | 78 |
| Stock | |
| Weighted Average PE Ratio | -- |
| Weighted Average Price to Sales Ratio | -- |
| Weighted Average Price to Book Ratio | -- |
| Weighted Median ROE | -- |
| Weighted Median ROA | -- |
| ROI (TTM) | -- |
| Return on Investment (TTM) | -- |
| Earning Yield | -- |
| LT Debt / Shareholders Equity | -- |
| Number of Equity Holdings | 5 |
| Bond | |
| Yield to Maturity (12-31-25) | 7.96% |
| Effective Duration | -- |
| Average Coupon | 8.65% |
| Calculated Average Quality | 4.453 |
| Effective Maturity | 9.617 |
| Nominal Maturity | 9.617 |
| Number of Bond Holdings | 60 |
As of December 31, 2025
Growth Metrics
| EPS Growth (1Y) | -- |
| EPS Growth (3Y) | -- |
| EPS Growth (5Y) | -- |
| Sales Growth (1Y) | -- |
| Sales Growth (3Y) | -- |
| Sales Growth (5Y) | -- |
| Sales per Share Growth (1Y) | -- |
| Sales per Share Growth (3Y) | -- |
| Operating Cash Flow - Growth Rate (3Y) | -- |
As of December 31, 2025
Fund Details
| Key Dates | |
| Launch Date | 12/8/2025 |
| Last Annual Report Date | -- |
| Last Prospectus Date | 12/2/2025 |
| Attributes | |
| Index Fund | -- |
| Inverse Fund | No |
| Leveraged Fund | -- |
| Fund of Funds | No |
| Currency Hedged Fund | -- |
| Socially Responsible Fund | No |
Top Portfolio Holders
| Name | % Weight |
|---|---|
| Portfolio A | 5.00% |
| Portfolio B | 3.50% |
| Portfolio C | 2.25% |