

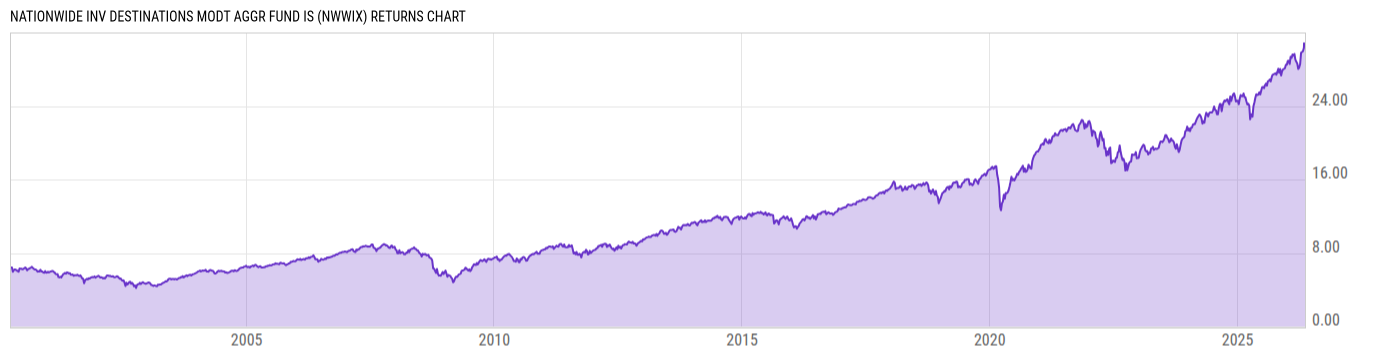
Nationwide Inv Destinations Modt Aggr Fund IS (NWWIX)
10.52
-0.07
(-0.66%)
USD |
Jun 03 2026
Returns Chart
Key Stats
| Net Expense Ratio | Total Assets Under Management | Weighted Average Dividend Yield | Turnover Ratio (Generic) |
|---|---|---|---|
| 0.62% | 936.26M | -- | 34.00% |
| 1 Year Fund Level Flows | 1 Year Total Returns (Daily) | Annualized Total Returns Since Inception (Daily) | Max Drawdown (Since Inception) |
| -135.23M | 23.47% |
Basic Info
| Investment Strategy | |
| The Fund seeks to maximize total investment return for a moderately aggressive level of risk. The Fund invests primarily in affiliated mutual funds representing a variety of asset classes. The Fund invests in mutual funds offered by Nationwide Funds. This may also include affiliated or unaffiliated exchange-traded funds. |
| General | |
| Security Type | Mutual Fund |
| Equity Style | -- |
| Broad Asset Class | Allocation |
| Broad Category | Allocation |
| Global Peer Group | Mixed Asset USD Aggressive |
| Peer Group | Mixed-Asset Target Alloc Growth Funds |
| Global Macro | Mixed Asset HC Aggressive |
| US Macro | Mixed-Assets Target Allocation Funds |
| YCharts Categorization | -- |
| YCharts Benchmark | -- |
| Prospectus Objective | Growth & Income Funds |
| Fund Owner Firm Name | Nationwide |
| Broad Asset Class Benchmark Index | |
| ^SPXTR | 100.0% |
Net Fund Flows Versus Peer Group
1 Month
% Rank:
56
-3.410B
Peer Group Low
327.50M
Peer Group High
1 Year
% Rank:
62
-135.23M
-13.08B
Peer Group Low
3.669B
Peer Group High
3 Months
% Rank:
62
-4.575B
Peer Group Low
893.21M
Peer Group High
3 Years
% Rank:
74
-27.75B
Peer Group Low
5.767B
Peer Group High
6 Months
% Rank:
58
-9.226B
Peer Group Low
2.137B
Peer Group High
5 Years
% Rank:
74
-38.97B
Peer Group Low
5.767B
Peer Group High
YTD
% Rank:
57
-6.581B
Peer Group Low
1.845B
Peer Group High
10 Years
% Rank:
77
-59.18B
Peer Group Low
12.16B
Peer Group High
Date Unavailable
Risk
Performance Versus Peer Group
Annual Total Returns Versus Peers
As of June 04, 2026.
Asset Allocation
As of April 30, 2026.
| Type | % Net |
|---|---|
| Cash | 1.02% |
| Stock | 78.81% |
| Bond | 3.20% |
| Convertible | 0.00% |
| Preferred | 0.22% |
| Other | 16.75% |
Top 10 Holdings
| Name | % Weight | Price | % Change |
|---|---|---|---|
| Nationwide Bond Portfolio R6 | 16.01% | 8.60 | -0.12% |
| Nationwide International Equity Portfolio R6 | 13.23% | 14.76 | -0.81% |
| Nationwide Large Cap Equity Portfolio R6 | 11.20% | 11.92 | -0.75% |
| Nationwide US 130/30 Equity Portfolio R6 | 11.19% | 13.36 | -0.89% |
| Nationwide International Index Fund R6 | 10.66% | 11.37 | -0.70% |
| Nationwide Fundamental All Cap Equity Portfolio R6 | 8.86% | 13.83 | -0.79% |
| iShares Core MSCI Emerging Markets ETF | 8.61% | 84.84 | -1.34% |
| Nationwide Mid Cap Market Index Fund R6 | 5.92% | 17.74 | -0.06% |
| iShares Core S&P Small-Cap ETF | 4.34% | 138.45 | -0.89% |
| iShares Core S&P 500 ETF | 3.32% | 757.25 | -0.76% |
Fees & Availability
| Fees | |
| Actual 12B-1 Fee | -- |
| Actual Management Fee | 0.13% |
| Administration Fee | 5.10K% |
| Maximum Front Load | -- |
| Maximum Deferred Load | -- |
| Maximum Redemption Fee | -- |
| General Availability | |
| Available for Insurance Product | No |
| Available for RRSP | No |
| Purchase Details | |
| Open to New Investors |
|
| Minimum Initial Investment | 50000.00 None |
| Minimum Subsequent Investment | 0.00 None |
Basic Info
| Investment Strategy | |
| The Fund seeks to maximize total investment return for a moderately aggressive level of risk. The Fund invests primarily in affiliated mutual funds representing a variety of asset classes. The Fund invests in mutual funds offered by Nationwide Funds. This may also include affiliated or unaffiliated exchange-traded funds. |
| General | |
| Security Type | Mutual Fund |
| Equity Style | -- |
| Broad Asset Class | Allocation |
| Broad Category | Allocation |
| Global Peer Group | Mixed Asset USD Aggressive |
| Peer Group | Mixed-Asset Target Alloc Growth Funds |
| Global Macro | Mixed Asset HC Aggressive |
| US Macro | Mixed-Assets Target Allocation Funds |
| YCharts Categorization | -- |
| YCharts Benchmark | -- |
| Prospectus Objective | Growth & Income Funds |
| Fund Owner Firm Name | Nationwide |
| Broad Asset Class Benchmark Index | |
| ^SPXTR | 100.0% |
Fundamentals
| General | |
| Distribution Yield | -- |
| Dividend Yield TTM (6-2-26) | 4.19% |
| 30-Day SEC Yield | -- |
| 7-Day SEC Yield | -- |
| Number of Holdings | 17 |
| Stock | |
| Weighted Average PE Ratio | 26.69 |
| Weighted Average Price to Sales Ratio | 5.300 |
| Weighted Average Price to Book Ratio | 6.798 |
| Weighted Median ROE | 54.01% |
| Weighted Median ROA | 11.07% |
| ROI (TTM) | 17.06% |
| Return on Investment (TTM) | 17.06% |
| Earning Yield | 0.0507 |
| LT Debt / Shareholders Equity | 0.8559 |
| Number of Equity Holdings | 0 |
As of April 30, 2026
Growth Metrics
| EPS Growth (1Y) | 22.10% |
| EPS Growth (3Y) | 15.14% |
| EPS Growth (5Y) | 19.81% |
| Sales Growth (1Y) | 11.29% |
| Sales Growth (3Y) | 10.64% |
| Sales Growth (5Y) | 12.95% |
| Sales per Share Growth (1Y) | 23.42% |
| Sales per Share Growth (3Y) | 11.43% |
| Operating Cash Flow - Growth Rate (3Y) | 20.44% |
As of April 30, 2026
Fund Details
Top Portfolio Holders
| Name | % Weight |
|---|---|
| Portfolio A | 5.00% |
| Portfolio B | 3.50% |
| Portfolio C | 2.25% |
Excel Add-In Codes
| Name: =YCI("M:NWWIX", "name") |
| Broad Asset Class: =YCI("M:NWWIX", "broad_asset_class") |
| Broad Category: =YCI("M:NWWIX", "broad_category_group") |
| Prospectus Objective: =YCI("M:NWWIX", "prospectus_objective") |
| To find the codes for any of our securities and financial metrics, see our Complete Excel Reference. |