

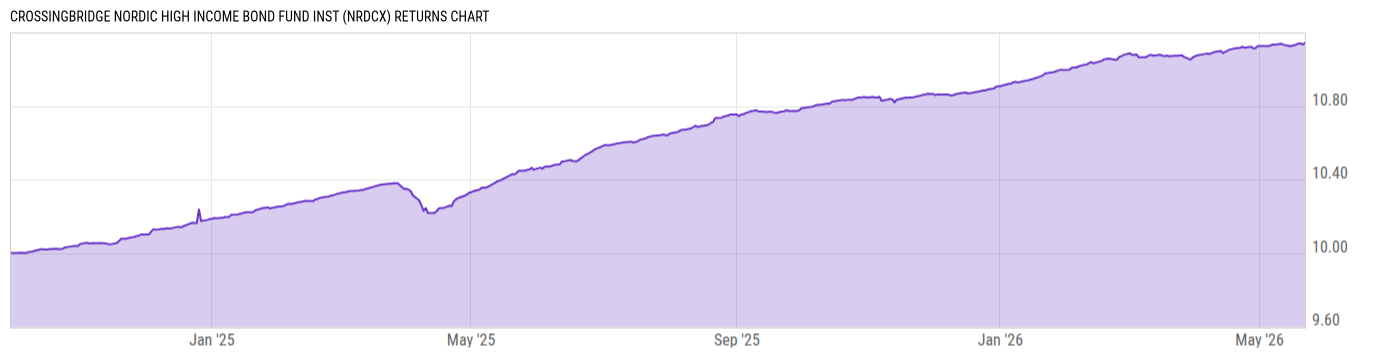
CrossingBridge Nordic High Income Bond Fund Inst (NRDCX)
9.999
+0.01
(+0.08%)
USD |
May 22 2026
Returns Chart
Key Stats
| Net Expense Ratio | Total Assets Under Management | Weighted Average Dividend Yield | Turnover Ratio (Generic) |
|---|---|---|---|
| 0.97% | 97.43M | -- | 76.00% |
| 1 Year Fund Level Flows | 1 Year Total Returns (Daily) | Annualized Total Returns Since Inception (Daily) | Max Drawdown (Since Inception) |
| 39.93M | 6.79% |
Basic Info
| Investment Strategy | |
| The Fund seeks high current income and capital appreciation consistent with the preservation of capital. The Fund seeks to achieve its investment objective by investing at least 80% of its net assets, in income producing bonds that are issued, originated, or underwritten out of the Nordic Countries. |
| General | |
| Security Type | Mutual Fund |
| Equity Style | -- |
| Broad Asset Class | Taxable Bond |
| Broad Category | Fixed Income |
| Global Peer Group | Bond Other |
| Peer Group | International Income Funds |
| Global Macro | Bond Other |
| US Macro | World Income Funds |
| YCharts Categorization | -- |
| YCharts Benchmark | -- |
| Prospectus Objective | International Income Funds |
| Fund Owner Firm Name | CrossingBridge |
| Broad Asset Class Benchmark Index | |
| ^BBUSATR | 100.0% |
Net Fund Flows Versus Peer Group
1 Month
% Rank:
55
-627.55M
Peer Group Low
1.614B
Peer Group High
1 Year
% Rank:
84
39.93M
-351876.0
Peer Group Low
16.79B
Peer Group High
3 Months
% Rank:
67
-31.12M
Peer Group Low
9.985B
Peer Group High
3 Years
% Rank:
64
-187.87M
Peer Group Low
34.15B
Peer Group High
6 Months
% Rank:
82
-68.41M
Peer Group Low
12.79B
Peer Group High
5 Years
% Rank:
50
-9.035B
Peer Group Low
104.64B
Peer Group High
YTD
% Rank:
70
-25.52M
Peer Group Low
9.985B
Peer Group High
10 Years
% Rank:
62
-5.060B
Peer Group Low
141.48B
Peer Group High
Date Unavailable
Risk
Performance Versus Peer Group
Annual Total Returns Versus Peers
As of May 25, 2026.
Asset Allocation
As of March 31, 2026.
| Type | % Net |
|---|---|
| Cash | 10.03% |
| Stock | 0.00% |
| Bond | 88.77% |
| Convertible | 0.00% |
| Preferred | 0.00% |
| Other | 1.20% |
Top 10 Holdings
| Name | % Weight | Price | % Change |
|---|---|---|---|
| First American Government Obligations Fd X | 5.77% | 1.00 | 0.00% |
| First American Treasury Obligations Fund X | 5.77% | 1.00 | 0.00% |
|
USD Cash
|
4.34% | -- | -- |
|
Norway, Kingdom Of (Government) 1.75% 17-FEB-2027
|
2.89% | -- | -- |
|
Norway, Kingdom Of (Government) 2% 26-APR-2028
|
2.81% | -- | -- |
|
Statnett SF 4.599% 12-MAY-2031
|
2.31% | -- | -- |
|
Tier Mobility SE 10.038% 27-OCT-2029
|
2.21% | -- | -- |
|
Specac International Ltd 0% 16-SEP-2030
|
2.16% | -- | -- |
|
Stockwik Forvaltning AB 9.421% 26-JUN-2029
|
2.08% | -- | -- |
|
CCIT Holdings AS FRN 28-Feb-2029
|
2.03% | -- | -- |
Fees & Availability
| Fees | |
| Actual 12B-1 Fee | -- |
| Actual Management Fee | 0.25% |
| Administration Fee | 61.82K% |
| Maximum Front Load | -- |
| Maximum Deferred Load | -- |
| Maximum Redemption Fee | -- |
| General Availability | |
| Available for Insurance Product | No |
| Available for RRSP | No |
| Purchase Details | |
| Open to New Investors |
|
| Minimum Initial Investment | 5000.00 None |
| Minimum Subsequent Investment | 0.00 None |
Basic Info
| Investment Strategy | |
| The Fund seeks high current income and capital appreciation consistent with the preservation of capital. The Fund seeks to achieve its investment objective by investing at least 80% of its net assets, in income producing bonds that are issued, originated, or underwritten out of the Nordic Countries. |
| General | |
| Security Type | Mutual Fund |
| Equity Style | -- |
| Broad Asset Class | Taxable Bond |
| Broad Category | Fixed Income |
| Global Peer Group | Bond Other |
| Peer Group | International Income Funds |
| Global Macro | Bond Other |
| US Macro | World Income Funds |
| YCharts Categorization | -- |
| YCharts Benchmark | -- |
| Prospectus Objective | International Income Funds |
| Fund Owner Firm Name | CrossingBridge |
| Broad Asset Class Benchmark Index | |
| ^BBUSATR | 100.0% |
Fundamentals
| General | |
| Distribution Yield | -- |
| Dividend Yield TTM (5-21-26) | 7.95% |
| 30-Day SEC Yield (3-31-26) | 7.36% |
| 7-Day SEC Yield | -- |
| Number of Holdings | 86 |
| Bond | |
| Yield to Maturity (3-31-26) | 7.21% |
| Effective Duration | -- |
| Average Coupon | 7.45% |
| Calculated Average Quality | 2.276 |
| Effective Maturity | 2.980 |
| Nominal Maturity | 2.980 |
| Number of Bond Holdings | 75 |
As of March 31, 2026
Fund Details
| Key Dates | |
| Inception Date | 9/30/2024 |
| Last Annual Report Date | 9/30/2025 |
| Last Prospectus Date | 1/28/2026 |
| Attributes | |
| Index Fund | -- |
| Inverse Fund | No |
| Leveraged Fund | -- |
| Fund of Funds | No |
| Currency Hedged Fund | -- |
| Socially Responsible Fund | No |
Top Portfolio Holders
| Name | % Weight |
|---|---|
| Portfolio A | 5.00% |
| Portfolio B | 3.50% |
| Portfolio C | 2.25% |
Excel Add-In Codes
| Name: =YCI("M:NRDCX", "name") |
| Broad Asset Class: =YCI("M:NRDCX", "broad_asset_class") |
| Broad Category: =YCI("M:NRDCX", "broad_category_group") |
| Prospectus Objective: =YCI("M:NRDCX", "prospectus_objective") |
| To find the codes for any of our securities and financial metrics, see our Complete Excel Reference. |