

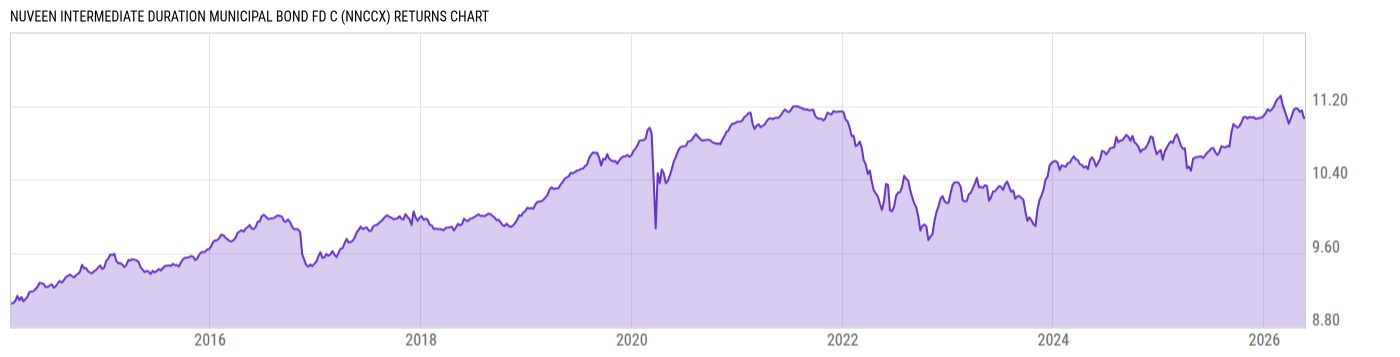
Nuveen Intermediate Duration Municipal Bond Fd C (NNCCX)
8.79
+0.01
(+0.11%)
USD |
May 22 2026
Returns Chart
Key Stats
| Net Expense Ratio | Total Assets Under Management | Weighted Average Dividend Yield | Turnover Ratio (Generic) |
|---|---|---|---|
| 1.44% | 8.842B | -- | 27.00% |
| 1 Year Fund Level Flows | 1 Year Total Returns (Daily) | Annualized Total Returns Since Inception (Daily) | Max Drawdown (Since Inception) |
| 879.29M | 4.44% |
Basic Info
| Investment Strategy | |
| The Fund seeks to provide high tax-free income and preservation of capital through investments in diversified portfolios of quality municipal bonds. |
| General | |
| Security Type | Mutual Fund |
| Equity Style | -- |
| Broad Asset Class | Municipal Bond |
| Broad Category | Fixed Income |
| Global Peer Group | Bond USD Municipal |
| Peer Group | Intermediate Municipal Debt Funds |
| Global Macro | Bond HC |
| US Macro | National Municipal Debt Funds |
| YCharts Categorization | -- |
| YCharts Benchmark | -- |
| Prospectus Objective | Intermediate Municipal Debt Funds |
| Fund Owner Firm Name | Nuveen |
| Broad Asset Class Benchmark Index | |
| ^BBMBTR | 100.0% |
Net Fund Flows Versus Peer Group
1 Month
% Rank:
96
-34.75M
Peer Group Low
395.85M
Peer Group High
1 Year
% Rank:
7
879.29M
-744.70M
Peer Group Low
5.870B
Peer Group High
3 Months
% Rank:
10
-552.57M
Peer Group Low
2.357B
Peer Group High
3 Years
% Rank:
27
-1.653B
Peer Group Low
11.23B
Peer Group High
6 Months
% Rank:
12
-608.53M
Peer Group Low
4.635B
Peer Group High
5 Years
% Rank:
93
-2.349B
Peer Group Low
5.178B
Peer Group High
YTD
% Rank:
10
-564.63M
Peer Group Low
2.357B
Peer Group High
10 Years
% Rank:
12
-2.849B
Peer Group Low
29.03B
Peer Group High
Date Unavailable
Risk
Performance Versus Peer Group
Annual Total Returns Versus Peers
As of May 24, 2026.
Asset Allocation
As of March 31, 2026.
| Type | % Net |
|---|---|
| Cash | 1.25% |
| Stock | 0.00% |
| Bond | 98.60% |
| Convertible | 0.00% |
| Preferred | 0.00% |
| Other | 0.15% |
Top 10 Holdings
| Name | % Weight | Price | % Change |
|---|---|---|---|
| PUERTO RICO SALES TAX FING CORP SALES TAX REV PR 0.000 07/01/2031 | 0.60% | 83.46 | 0.14% |
|
USD Cash
|
0.59% | -- | -- |
|
Accounts Receivable
|
0.52% | -- | -- |
| WASHINGTON ST HSG FIN COMMN WA 3.500 12/20/2035 | 0.43% | 95.03 | 0.17% |
| NEW JERSEY ECONOMIC DEV AUTH WTR FACS REV NJ 2.200 10/01/2039 | 0.40% | 94.00 | 0.14% |
| COLORADO HEALTH FACS AUTH REV CO 5.000 08/01/2049 | 0.38% | 100.14 | 0.00% |
| REID HOSP & HEALTH CARE SVCS INC RICHMOND IND HOSP AUTH REV IN 5.000 01/01/2036 | 0.38% | 100.10 | 0.00% |
| DISTRICT COLUMBIA TOB SETTLEMENT FING CORP DC 0.000 06/15/2046 | 0.38% | 22.58 | 0.48% |
| NEW YORK TRANSN DEV CORP SPL FAC REV NY 5.250 01/01/2050 | 0.34% | 100.02 | 0.00% |
| ILLINOIS FIN AUTH REV IL 4.000 02/15/2041 | 0.32% | 100.84 | 0.00% |
Fees & Availability
| Fees | |
| Actual 12B-1 Fee | 1.00% |
| Actual Management Fee | 0.38% |
| Administration Fee | -- |
| Maximum Front Load | -- |
| Maximum Deferred Load | 1.00% |
| Maximum Redemption Fee | -- |
| General Availability | |
| Available for Insurance Product | -- |
| Available for RRSP | -- |
| Purchase Details | |
| Open to New Investors |
|
| Minimum Initial Investment | 2500.00 None |
| Minimum Subsequent Investment | 100.00 None |
Basic Info
| Investment Strategy | |
| The Fund seeks to provide high tax-free income and preservation of capital through investments in diversified portfolios of quality municipal bonds. |
| General | |
| Security Type | Mutual Fund |
| Equity Style | -- |
| Broad Asset Class | Municipal Bond |
| Broad Category | Fixed Income |
| Global Peer Group | Bond USD Municipal |
| Peer Group | Intermediate Municipal Debt Funds |
| Global Macro | Bond HC |
| US Macro | National Municipal Debt Funds |
| YCharts Categorization | -- |
| YCharts Benchmark | -- |
| Prospectus Objective | Intermediate Municipal Debt Funds |
| Fund Owner Firm Name | Nuveen |
| Broad Asset Class Benchmark Index | |
| ^BBMBTR | 100.0% |
Fundamentals
| General | |
| Distribution Yield | -- |
| Dividend Yield TTM (5-21-26) | 2.41% |
| 30-Day SEC Yield (3-31-26) | 2.04% |
| 7-Day SEC Yield | -- |
| Number of Holdings | 1904 |
| Bond | |
| Yield to Maturity (3-31-26) | 3.70% |
| Effective Duration | 5.50 |
| Average Coupon | 4.39% |
| Calculated Average Quality | 2.465 |
| Effective Maturity | 8.975 |
| Nominal Maturity | 12.06 |
| Number of Bond Holdings | 1854 |
As of March 31, 2026
Fund Details
Top Portfolio Holders
| Name | % Weight |
|---|---|
| Portfolio A | 5.00% |
| Portfolio B | 3.50% |
| Portfolio C | 2.25% |
Excel Add-In Codes
| Name: =YCI("M:NNCCX", "name") |
| Broad Asset Class: =YCI("M:NNCCX", "broad_asset_class") |
| Broad Category: =YCI("M:NNCCX", "broad_category_group") |
| Prospectus Objective: =YCI("M:NNCCX", "prospectus_objective") |
| To find the codes for any of our securities and financial metrics, see our Complete Excel Reference. |