

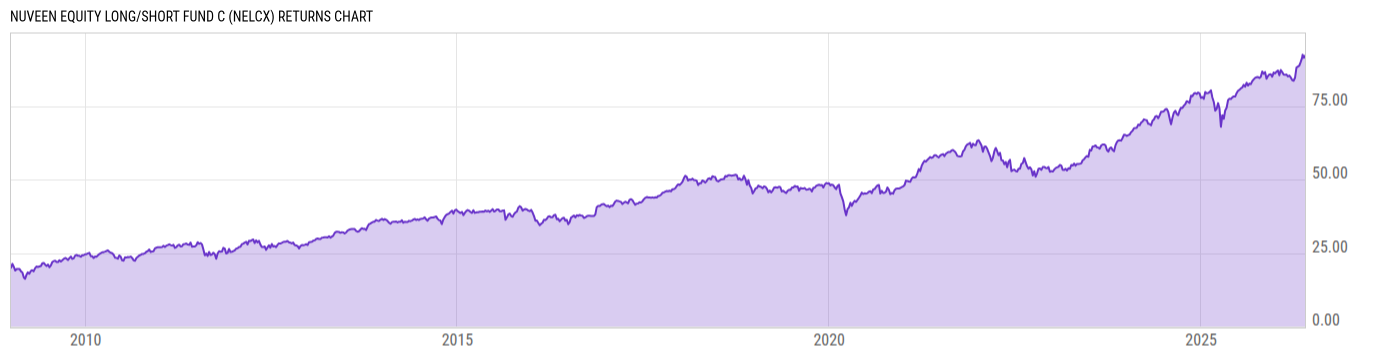
Nuveen Equity Long/Short Fund C (NELCX)
58.36
+0.38
(+0.66%)
USD |
May 26 2026
Returns Chart
Key Stats
| Net Expense Ratio | Total Assets Under Management | Weighted Average Dividend Yield | Turnover Ratio (Generic) |
|---|---|---|---|
| 2.91% | 159.41M | -- | 65.00% |
| 1 Year Fund Level Flows | 1 Year Total Returns (Daily) | Annualized Total Returns Since Inception (Daily) | Max Drawdown (Since Inception) |
| -9.539M | 20.68% |
Basic Info
| Investment Strategy | |
| The Fund seeks long-term capital appreciation with low correlation to the U.S. equity market. The Fund will establish long and short positions in a diversified portfolio of equity securities, in which at least 80% of the sum of its net assets and the amount of any borrowings for investment purposes will be invested. |
| General | |
| Security Type | Mutual Fund |
| Equity Style | -- |
| Broad Asset Class | Alternative |
| Broad Category | Alternative Strategies |
| Global Peer Group | Alternative Long/Short Equity US |
| Peer Group | Alternative Long/Short Equity Funds |
| Global Macro | Alternative Equity |
| US Macro | Alternative Equity Funds |
| YCharts Categorization | -- |
| YCharts Benchmark | -- |
| Prospectus Objective | Alternative Long/Short Equity Funds |
| Fund Owner Firm Name | Nuveen |
| Broad Asset Class Benchmark Index | |
| ^MSACWINTR | 100.0% |
Net Fund Flows Versus Peer Group
1 Month
% Rank:
54
-77.77M
Peer Group Low
734.73M
Peer Group High
1 Year
% Rank:
75
-9.539M
-232.19M
Peer Group Low
5.181B
Peer Group High
3 Months
% Rank:
71
-58.92M
Peer Group Low
1.832B
Peer Group High
3 Years
% Rank:
55
-569.68M
Peer Group Low
8.511B
Peer Group High
6 Months
% Rank:
76
-150.87M
Peer Group Low
3.044B
Peer Group High
5 Years
% Rank:
76
-1.077B
Peer Group Low
8.721B
Peer Group High
YTD
% Rank:
73
-68.79M
Peer Group Low
2.522B
Peer Group High
10 Years
% Rank:
72
-6.886B
Peer Group Low
7.604B
Peer Group High
Date Unavailable
Risk
Performance Versus Peer Group
Annual Total Returns Versus Peers
As of May 27, 2026.
Asset Allocation
As of April 30, 2026.
| Type | % Net |
|---|---|
| Cash | 29.73% |
| Stock | 70.40% |
| Bond | 0.00% |
| Convertible | 0.00% |
| Preferred | 0.00% |
| Other | -0.13% |
Top 10 Holdings
| Name | % Weight | Price | % Change |
|---|---|---|---|
|
USD CASH
|
28.37% | -- | -- |
| Apple, Inc. | 4.98% | 310.90 | 0.83% |
| Alphabet, Inc. | 4.95% | 388.58 | -0.08% |
| NVIDIA Corp. | 4.71% | 212.61 | -1.05% |
| Microsoft Corp. | 3.72% | 412.60 | -0.82% |
| Broadcom Inc. | 3.02% | 421.86 | -0.04% |
| Amazon.com, Inc. | 2.42% | 271.85 | 2.47% |
| JPMorgan Chase & Co. | 1.72% | 299.20 | -2.46% |
| Intel Corp. | 1.53% | 121.80 | -1.39% |
| Netflix, Inc. | 1.39% | 87.32 | -0.41% |
Fees & Availability
| Fees | |
| Actual 12B-1 Fee | 1.00% |
| Actual Management Fee | 1.11% |
| Administration Fee | -- |
| Maximum Front Load | -- |
| Maximum Deferred Load | 1.00% |
| Maximum Redemption Fee | -- |
| General Availability | |
| Available for Insurance Product | No |
| Available for RRSP | No |
| Purchase Details | |
| Open to New Investors |
|
| Minimum Initial Investment | 2500.00 None |
| Minimum Subsequent Investment | 100.00 None |
Basic Info
| Investment Strategy | |
| The Fund seeks long-term capital appreciation with low correlation to the U.S. equity market. The Fund will establish long and short positions in a diversified portfolio of equity securities, in which at least 80% of the sum of its net assets and the amount of any borrowings for investment purposes will be invested. |
| General | |
| Security Type | Mutual Fund |
| Equity Style | -- |
| Broad Asset Class | Alternative |
| Broad Category | Alternative Strategies |
| Global Peer Group | Alternative Long/Short Equity US |
| Peer Group | Alternative Long/Short Equity Funds |
| Global Macro | Alternative Equity |
| US Macro | Alternative Equity Funds |
| YCharts Categorization | -- |
| YCharts Benchmark | -- |
| Prospectus Objective | Alternative Long/Short Equity Funds |
| Fund Owner Firm Name | Nuveen |
| Broad Asset Class Benchmark Index | |
| ^MSACWINTR | 100.0% |
Fundamentals
| General | |
| Distribution Yield | -- |
| Dividend Yield TTM (5-22-26) | 0.10% |
| 30-Day SEC Yield (4-30-26) | -0.89% |
| 7-Day SEC Yield | -- |
| Number of Holdings | 10 |
| Stock | |
| Weighted Average PE Ratio | 33.48 |
| Weighted Average Price to Sales Ratio | 8.009 |
| Weighted Average Price to Book Ratio | 9.848 |
| Weighted Median ROE | 125.7% |
| Weighted Median ROA | 15.70% |
| ROI (TTM) | 22.49% |
| Return on Investment (TTM) | 22.49% |
| Earning Yield | 0.0360 |
| LT Debt / Shareholders Equity | 0.6624 |
| Number of Equity Holdings | 9 |
As of April 30, 2026
Growth Metrics
| EPS Growth (1Y) | 29.95% |
| EPS Growth (3Y) | 21.29% |
| EPS Growth (5Y) | 24.97% |
| Sales Growth (1Y) | 13.90% |
| Sales Growth (3Y) | 12.83% |
| Sales Growth (5Y) | 14.02% |
| Sales per Share Growth (1Y) | 14.75% |
| Sales per Share Growth (3Y) | 13.59% |
| Operating Cash Flow - Growth Rate (3Y) | 24.34% |
As of April 30, 2026
Fund Details
Top Portfolio Holders
| Name | % Weight |
|---|---|
| Portfolio A | 5.00% |
| Portfolio B | 3.50% |
| Portfolio C | 2.25% |
Excel Add-In Codes
| Name: =YCI("M:NELCX", "name") |
| Broad Asset Class: =YCI("M:NELCX", "broad_asset_class") |
| Broad Category: =YCI("M:NELCX", "broad_category_group") |
| Prospectus Objective: =YCI("M:NELCX", "prospectus_objective") |
| To find the codes for any of our securities and financial metrics, see our Complete Excel Reference. |