

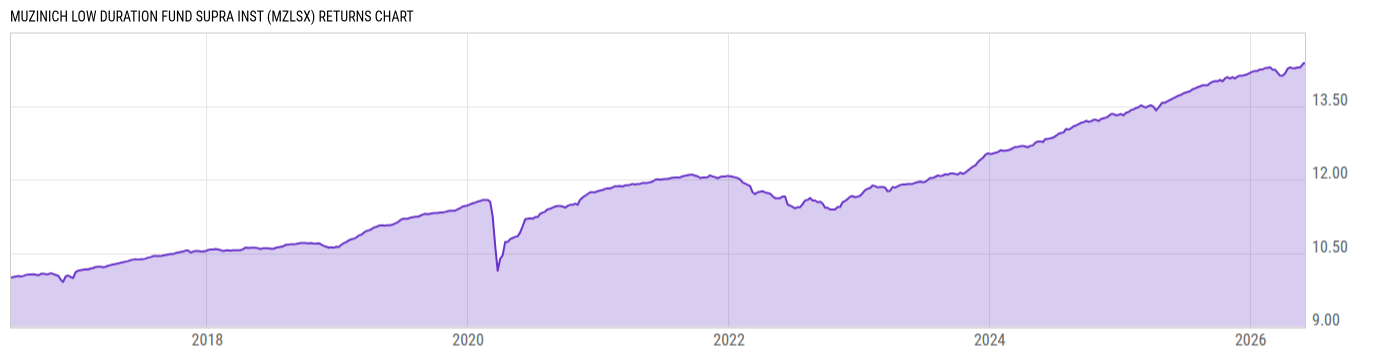
Muzinich Low Duration Fund Supra Inst (MZLSX)
9.41
+0.01
(+0.11%)
USD |
Jun 02 2026
Returns Chart
Key Stats
| Net Expense Ratio | Total Assets Under Management | Weighted Average Dividend Yield | Turnover Ratio (Generic) |
|---|---|---|---|
| 0.50% | 1.146B | -- | 69.00% |
| 1 Year Fund Level Flows | 1 Year Total Returns (Daily) | Annualized Total Returns Since Inception (Daily) | Max Drawdown (Since Inception) |
| -112.57M | 5.11% |
Basic Info
| Investment Strategy | |
| The Fund seeks to protect capital and generate positive returns. The Fund normally invests at least 80% of the Funds net assets in a well-diversified portfolio of corporate bonds and senior bank loans, including floating rate loans and restricted securities such as bonds issued pursuant to regulation 144(a). |
| General | |
| Security Type | Mutual Fund |
| Equity Style | -- |
| Broad Asset Class | Taxable Bond |
| Broad Category | Fixed Income |
| Global Peer Group | Bond USD Short Term |
| Peer Group | Short Investment Grade Debt Funds |
| Global Macro | Bond Short Term |
| US Macro | Short/Intermediate Investment-Grade Funds |
| YCharts Categorization | -- |
| YCharts Benchmark | -- |
| Prospectus Objective | Short Investment Grade Debt Funds |
| Fund Owner Firm Name | Muzinich & Co |
| Broad Asset Class Benchmark Index | |
| ^BBUSATR | 100.0% |
Net Fund Flows Versus Peer Group
1 Month
% Rank:
24
-151.00M
Peer Group Low
1.615B
Peer Group High
1 Year
% Rank:
87
-112.57M
-5.690B
Peer Group Low
6.766B
Peer Group High
3 Months
% Rank:
35
-2.968B
Peer Group Low
3.273B
Peer Group High
3 Years
% Rank:
69
-11.60B
Peer Group Low
8.054B
Peer Group High
6 Months
% Rank:
34
-4.269B
Peer Group Low
6.766B
Peer Group High
5 Years
% Rank:
12
-25.47B
Peer Group Low
9.200B
Peer Group High
YTD
% Rank:
22
-3.260B
Peer Group Low
6.765B
Peer Group High
10 Years
% Rank:
23
-10.99B
Peer Group Low
24.01B
Peer Group High
Date Unavailable
Risk
Performance Versus Peer Group
Annual Total Returns Versus Peers
As of June 03, 2026.
Asset Allocation
As of April 30, 2026.
| Type | % Net |
|---|---|
| Cash | 0.31% |
| Stock | 0.00% |
| Bond | 98.45% |
| Convertible | 0.00% |
| Preferred | 0.00% |
| Other | 1.24% |
Top 10 Holdings
| Name | % Weight | Price | % Change |
|---|---|---|---|
|
Other Assets less Liabilities
|
1.48% | -- | -- |
| CCO Holdings, LLC CHTR-CCOH 5.375 06/01/2029 FIX USD Corporate 144A | 0.77% | 98.15 | 0.00% |
| CK HUTCHISON INTERNATIONAL (24) LIMITED CKHUTBC 5.375 04/26/2029 FIX USD Corporate RegS | 0.73% | 102.52 | 0.00% |
|
Deutsche Bank AG 4% 24-JUN-2032
|
0.65% | -- | -- |
|
Jaguar Land Rover Automotive PLC 4.5% 15-JUL-2028
|
0.58% | -- | -- |
|
HSBC Holdings PLC 4.599% 22-MAR-2035
|
0.55% | -- | -- |
| First American Treasury Obligations Fund X | 0.53% | 1.00 | 0.00% |
| TALLGRASS ENERGY PARTNERS, LP TALLENAC 5.5 01/15/2028 FIX USD Corporate 144A | 0.52% | 100.17 | 0.13% |
|
HSBC Holdings PLC 6.364% 16-NOV-2032
|
0.52% | -- | -- |
|
Yorkshire Water Finance PLC 1.75% 26-NOV-2026
|
0.52% | -- | -- |
Fees & Availability
| Fees | |
| Actual 12B-1 Fee | -- |
| Actual Management Fee | 0.37% |
| Administration Fee | 495.8K% |
| Maximum Front Load | -- |
| Maximum Deferred Load | -- |
| Maximum Redemption Fee | 1.00% |
| General Availability | |
| Available for Insurance Product | No |
| Available for RRSP | No |
| Purchase Details | |
| Open to New Investors |
|
| Minimum Initial Investment | 1.00M None |
| Minimum Subsequent Investment | 100.00 None |
Basic Info
| Investment Strategy | |
| The Fund seeks to protect capital and generate positive returns. The Fund normally invests at least 80% of the Funds net assets in a well-diversified portfolio of corporate bonds and senior bank loans, including floating rate loans and restricted securities such as bonds issued pursuant to regulation 144(a). |
| General | |
| Security Type | Mutual Fund |
| Equity Style | -- |
| Broad Asset Class | Taxable Bond |
| Broad Category | Fixed Income |
| Global Peer Group | Bond USD Short Term |
| Peer Group | Short Investment Grade Debt Funds |
| Global Macro | Bond Short Term |
| US Macro | Short/Intermediate Investment-Grade Funds |
| YCharts Categorization | -- |
| YCharts Benchmark | -- |
| Prospectus Objective | Short Investment Grade Debt Funds |
| Fund Owner Firm Name | Muzinich & Co |
| Broad Asset Class Benchmark Index | |
| ^BBUSATR | 100.0% |
Fundamentals
| General | |
| Distribution Yield | -- |
| Dividend Yield TTM (6-1-26) | 7.23% |
| 30-Day SEC Yield (7-31-17) | 0.00% |
| 7-Day SEC Yield | -- |
| Number of Holdings | 544 |
| Bond | |
| Yield to Maturity (4-30-26) | 4.63% |
| Effective Duration | -- |
| Average Coupon | 4.74% |
| Calculated Average Quality | 4.267 |
| Effective Maturity | 4.150 |
| Nominal Maturity | 4.315 |
| Number of Bond Holdings | 527 |
As of April 30, 2026
Fund Details
| Key Dates | |
| Inception Date | 6/30/2016 |
| Last Annual Report Date | 12/31/2025 |
| Last Prospectus Date | 4/30/2025 |
| Attributes | |
| Index Fund | -- |
| Inverse Fund | No |
| Leveraged Fund | -- |
| Fund of Funds | No |
| Currency Hedged Fund | -- |
| Socially Responsible Fund | No |
Top Portfolio Holders
| Name | % Weight |
|---|---|
| Portfolio A | 5.00% |
| Portfolio B | 3.50% |
| Portfolio C | 2.25% |
Excel Add-In Codes
| Name: =YCI("M:MZLSX", "name") |
| Broad Asset Class: =YCI("M:MZLSX", "broad_asset_class") |
| Broad Category: =YCI("M:MZLSX", "broad_category_group") |
| Prospectus Objective: =YCI("M:MZLSX", "prospectus_objective") |
| To find the codes for any of our securities and financial metrics, see our Complete Excel Reference. |