

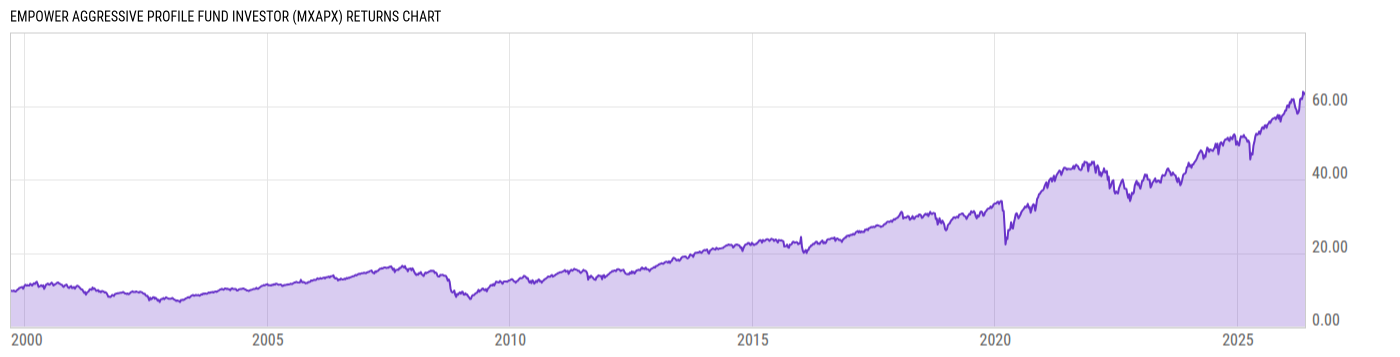
Empower Aggressive Profile Fund Investor (MXAPX)
6.60
+0.03
(+0.46%)
USD |
Jun 09 2026
Returns Chart
Key Stats
| Net Expense Ratio | Total Assets Under Management | Weighted Average Dividend Yield | Turnover Ratio (Generic) |
|---|---|---|---|
| 1.13% | 1.009B | -- | 19.00% |
| 1 Year Fund Level Flows | 1 Year Total Returns (Daily) | Annualized Total Returns Since Inception (Daily) | Max Drawdown (Since Inception) |
| 58.75M | 20.79% |
Basic Info
| Investment Strategy | |
| The Portfolio seeks long-term capital appreciation primarily through investments in Underlying Portfolios with an emphasis on equity investments. |
| General | |
| Security Type | Mutual Fund |
| Equity Style | -- |
| Broad Asset Class | Allocation |
| Broad Category | Allocation |
| Global Peer Group | Mixed Asset USD Aggressive |
| Peer Group | Mixed-Asset Target Alloc Agg Gro Funds |
| Global Macro | Mixed Asset HC Aggressive |
| US Macro | Mixed-Assets Target Allocation Funds |
| YCharts Categorization | -- |
| YCharts Benchmark | -- |
| Prospectus Objective | Growth Funds |
| Fund Owner Firm Name | Empower |
| Broad Asset Class Benchmark Index | |
| ^SPXTR | 100.0% |
Net Fund Flows Versus Peer Group
1 Month
% Rank:
57
-68.28M
Peer Group Low
36.80M
Peer Group High
1 Year
% Rank:
17
58.75M
-544.21M
Peer Group Low
725.02M
Peer Group High
3 Months
% Rank:
63
-170.87M
Peer Group Low
725.02M
Peer Group High
3 Years
% Rank:
21
-1.736B
Peer Group Low
858.19M
Peer Group High
6 Months
% Rank:
28
-302.06M
Peer Group Low
725.02M
Peer Group High
5 Years
% Rank:
46
-2.487B
Peer Group Low
1.040B
Peer Group High
YTD
% Rank:
47
-246.33M
Peer Group Low
725.02M
Peer Group High
10 Years
% Rank:
59
-4.485B
Peer Group Low
1.384B
Peer Group High
Date Unavailable
Risk
Performance Versus Peer Group
Annual Total Returns Versus Peers
As of June 10, 2026.
Asset Allocation
As of December 31, 2025.
| Type | % Net |
|---|---|
| Cash | 0.00% |
| Stock | 97.59% |
| Bond | 0.04% |
| Convertible | 0.00% |
| Preferred | 0.22% |
| Other | 2.15% |
Top 10 Holdings
| Name | % Weight | Price | % Change |
|---|---|---|---|
| Empower Large Cap Value Fund Institutional | 24.79% | 7.63 | 0.53% |
| Empower International Value Fund Inst | 17.06% | 11.00 | 0.27% |
| Empower Mid Cap Value Fund Inst | 12.56% | 9.39 | 0.64% |
| Empower Large Cap Growth Fund Institutional | 11.70% | 12.57 | -0.24% |
| Empower Small Cap Value Fund Inst | 7.12% | 7.96 | 1.40% |
| Empower Emerging Markets Equity Fund Inst | 6.95% | 15.07 | 0.94% |
| Empower International Growth Fund Inst | 6.80% | 9.64 | 0.10% |
| Empower T Rowe Price Mid Cap Growth Fund Inst | 6.25% | 4.92 | 1.03% |
| Empower Small Cap Growth Fund Institutional | 3.86% | 12.53 | 0.72% |
| Empower Real Estate Index Fund Institutional | 2.99% | 9.57 | 2.35% |
Fees & Availability
| Fees | |
| Actual 12B-1 Fee | -- |
| Actual Management Fee | 0.10% |
| Administration Fee | -- |
| Maximum Front Load | -- |
| Maximum Deferred Load | -- |
| Maximum Redemption Fee | -- |
| General Availability | |
| Available for Insurance Product | No |
| Available for RRSP | No |
| Purchase Details | |
| Open to New Investors |
|
| Minimum Initial Investment | 0.00 None |
| Minimum Subsequent Investment | 0.00 None |
Basic Info
| Investment Strategy | |
| The Portfolio seeks long-term capital appreciation primarily through investments in Underlying Portfolios with an emphasis on equity investments. |
| General | |
| Security Type | Mutual Fund |
| Equity Style | -- |
| Broad Asset Class | Allocation |
| Broad Category | Allocation |
| Global Peer Group | Mixed Asset USD Aggressive |
| Peer Group | Mixed-Asset Target Alloc Agg Gro Funds |
| Global Macro | Mixed Asset HC Aggressive |
| US Macro | Mixed-Assets Target Allocation Funds |
| YCharts Categorization | -- |
| YCharts Benchmark | -- |
| Prospectus Objective | Growth Funds |
| Fund Owner Firm Name | Empower |
| Broad Asset Class Benchmark Index | |
| ^SPXTR | 100.0% |
Fundamentals
| General | |
| Distribution Yield | -- |
| Dividend Yield TTM (6-8-26) | 1.68% |
| 30-Day SEC Yield | -- |
| 7-Day SEC Yield | -- |
| Number of Holdings | 11 |
| Stock | |
| Weighted Average PE Ratio | 28.22 |
| Weighted Average Price to Sales Ratio | 5.231 |
| Weighted Average Price to Book Ratio | 5.819 |
| Weighted Median ROE | 27.24% |
| Weighted Median ROA | 7.83% |
| ROI (TTM) | 12.35% |
| Return on Investment (TTM) | 12.35% |
| Earning Yield | 0.0488 |
| LT Debt / Shareholders Equity | 0.9072 |
| Number of Equity Holdings | 0 |
As of December 31, 2025
Growth Metrics
| EPS Growth (1Y) | 21.16% |
| EPS Growth (3Y) | 11.38% |
| EPS Growth (5Y) | 14.35% |
| Sales Growth (1Y) | 8.87% |
| Sales Growth (3Y) | 10.21% |
| Sales Growth (5Y) | 10.59% |
| Sales per Share Growth (1Y) | 10.47% |
| Sales per Share Growth (3Y) | 10.36% |
| Operating Cash Flow - Growth Rate (3Y) | 13.09% |
As of December 31, 2025
Fund Details
| Key Dates | |
| Inception Date | 9/16/1999 |
| Last Annual Report Date | 12/31/2025 |
| Last Prospectus Date | 4/30/2026 |
| Share Classes | |
| MXGTX | Inst |
| Attributes | |
| Index Fund | -- |
| Inverse Fund | No |
| Leveraged Fund | -- |
| Fund of Funds |
|
| Currency Hedged Fund | -- |
| Socially Responsible Fund | No |
Top Portfolio Holders
| Name | % Weight |
|---|---|
| Portfolio A | 5.00% |
| Portfolio B | 3.50% |
| Portfolio C | 2.25% |
Excel Add-In Codes
| Name: =YCI("M:MXAPX", "name") |
| Broad Asset Class: =YCI("M:MXAPX", "broad_asset_class") |
| Broad Category: =YCI("M:MXAPX", "broad_category_group") |
| Prospectus Objective: =YCI("M:MXAPX", "prospectus_objective") |
| To find the codes for any of our securities and financial metrics, see our Complete Excel Reference. |