

Manning & Napier Pro-Blend Maximum Term Series R (MNHRX)
25.45
-0.40
(-1.55%)
USD |
Jun 10 2026
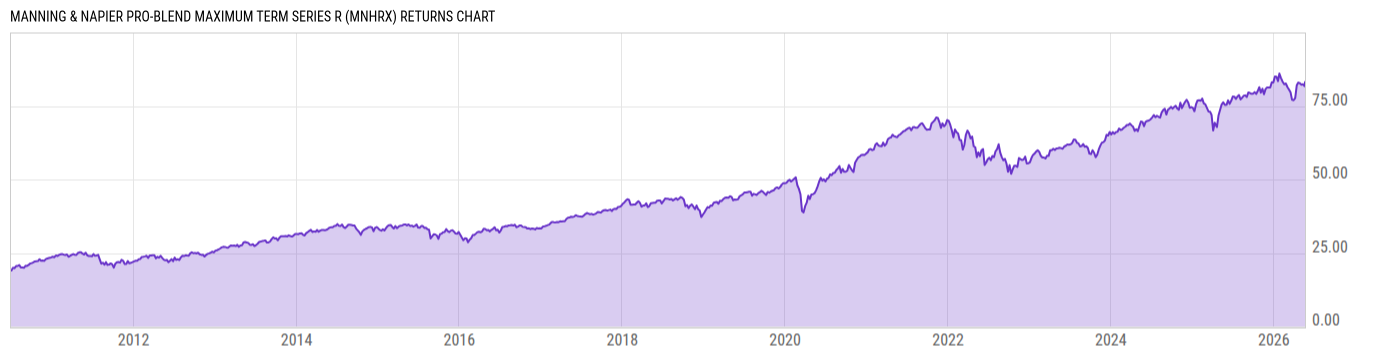
Returns Chart
Key Stats
| Net Expense Ratio | Total Assets Under Management | Weighted Average Dividend Yield | Turnover Ratio (Generic) |
|---|---|---|---|
| 1.31% | 395.77M | 1.08% | 86.00% |
| 1 Year Fund Level Flows | 1 Year Total Returns (Daily) | Annualized Total Returns Since Inception (Daily) | Max Drawdown (Since Inception) |
| -98.44M | 7.72% |
Basic Info
| Investment Strategy | |
| The Fund seeks to provide long-term growth of capital. The Fund invests primarily in common stocks, but may invest to a lesser extent in fixed income securities of any maturity. The Fund may invest in stocks of small, large, or mid-size companies. The Fund may invest in U.S. and foreign stocks and ADRs. |
| General | |
| Security Type | Mutual Fund |
| Equity Style | Large Cap Growth |
| Broad Asset Class | International Equity |
| Broad Category | Equity |
| Global Peer Group | Equity Global |
| Peer Group | Global Large-Cap Core |
| Global Macro | Equity Global |
| US Macro | Developed Global Markets Funds |
| YCharts Categorization | -- |
| YCharts Benchmark | -- |
| Prospectus Objective | Global Funds |
| Fund Owner Firm Name | Manning & Napier |
| Broad Asset Class Benchmark Index | |
| ^MSACXUSNTR | 100.0% |
Net Fund Flows Versus Peer Group
1 Month
% Rank:
63
-1.439B
Peer Group Low
143.93M
Peer Group High
1 Year
% Rank:
57
-98.44M
-12.12B
Peer Group Low
4.679B
Peer Group High
3 Months
% Rank:
62
-2.582B
Peer Group Low
1.405B
Peer Group High
3 Years
% Rank:
57
-28.33B
Peer Group Low
11.48B
Peer Group High
6 Months
% Rank:
64
-7.301B
Peer Group Low
4.870B
Peer Group High
5 Years
% Rank:
59
-36.25B
Peer Group Low
11.48B
Peer Group High
YTD
% Rank:
63
-4.525B
Peer Group Low
4.271B
Peer Group High
10 Years
% Rank:
66
-54.65B
Peer Group Low
13.12B
Peer Group High
Date Unavailable
Risk
Performance Versus Peer Group
Annual Total Returns Versus Peers
As of June 11, 2026.
Asset Allocation
As of April 30, 2026.
| Type | % Net |
|---|---|
| Cash | 0.71% |
| Stock | 84.37% |
| Bond | 12.98% |
| Convertible | 0.00% |
| Preferred | 0.00% |
| Other | 1.93% |
Top 10 Holdings
| Name | % Weight | Price | % Change |
|---|---|---|---|
| United States of America USGB 4.125 11/15/2032 FIX USD Government | 6.04% | 98.65 | -0.06% |
| Microsoft Corp. | 5.51% | 390.46 | -1.74% |
| NVIDIA Corp. | 5.31% | 202.28 | 0.93% |
| Amazon.com, Inc. | 4.11% | 236.94 | -0.45% |
| Mastercard, Inc. | 3.47% | 488.16 | -0.19% |
| Meta Platforms, Inc. | 3.34% | 562.59 | -1.47% |
| Alphabet, Inc. | 3.31% | 349.31 | -1.98% |
| Taiwan Semiconductor Manufacturing Co., Ltd. | 3.30% | 417.00 | 2.02% |
| Visa, Inc. | 2.95% | 321.57 | -0.43% |
| United Parcel Service, Inc. | 2.86% | 104.38 | 1.08% |
Fees & Availability
| Fees | |
| Actual 12B-1 Fee | 0.50% |
| Actual Management Fee | 0.60% |
| Administration Fee | -- |
| Maximum Front Load | -- |
| Maximum Deferred Load | -- |
| Maximum Redemption Fee | -- |
| General Availability | |
| Available for Insurance Product | No |
| Available for RRSP | No |
| Purchase Details | |
| Open to New Investors |
|
| Minimum Initial Investment | 2000.00 None |
| Minimum Subsequent Investment | 0.00 None |
Basic Info
| Investment Strategy | |
| The Fund seeks to provide long-term growth of capital. The Fund invests primarily in common stocks, but may invest to a lesser extent in fixed income securities of any maturity. The Fund may invest in stocks of small, large, or mid-size companies. The Fund may invest in U.S. and foreign stocks and ADRs. |
| General | |
| Security Type | Mutual Fund |
| Equity Style | Large Cap Growth |
| Broad Asset Class | International Equity |
| Broad Category | Equity |
| Global Peer Group | Equity Global |
| Peer Group | Global Large-Cap Core |
| Global Macro | Equity Global |
| US Macro | Developed Global Markets Funds |
| YCharts Categorization | -- |
| YCharts Benchmark | -- |
| Prospectus Objective | Global Funds |
| Fund Owner Firm Name | Manning & Napier |
| Broad Asset Class Benchmark Index | |
| ^MSACXUSNTR | 100.0% |
Fundamentals
| General | |
| Distribution Yield | -- |
| Dividend Yield TTM (6-10-26) | 0.26% |
| 30-Day SEC Yield (5-31-26) | 0.36% |
| 7-Day SEC Yield | -- |
| Number of Holdings | 137 |
| Stock | |
| Weighted Average PE Ratio | 31.51 |
| Weighted Average Price to Sales Ratio | 8.885 |
| Weighted Average Price to Book Ratio | 10.31 |
| Weighted Median ROE | 42.12% |
| Weighted Median ROA | 18.33% |
| ROI (TTM) | 25.67% |
| Return on Investment (TTM) | 25.67% |
| Earning Yield | 0.0375 |
| LT Debt / Shareholders Equity | 0.5558 |
| Number of Equity Holdings | 56 |
| Bond | |
| Yield to Maturity (4-30-26) | -- |
| Effective Duration | -- |
| Average Coupon | -- |
| Calculated Average Quality | -- |
| Effective Maturity | -- |
| Nominal Maturity | -- |
| Number of Bond Holdings | 69 |
As of April 30, 2026
Growth Metrics
| EPS Growth (1Y) | 26.58% |
| EPS Growth (3Y) | 22.07% |
| EPS Growth (5Y) | 25.29% |
| Sales Growth (1Y) | 14.48% |
| Sales Growth (3Y) | 15.93% |
| Sales Growth (5Y) | 15.14% |
| Sales per Share Growth (1Y) | 17.33% |
| Sales per Share Growth (3Y) | 16.23% |
| Operating Cash Flow - Growth Rate (3Y) | 24.42% |
As of April 30, 2026
Top Portfolio Holders
| Name | % Weight |
|---|---|
| Portfolio A | 5.00% |
| Portfolio B | 3.50% |
| Portfolio C | 2.25% |
Excel Add-In Codes
| Name: =YCI("M:MNHRX", "name") |
| Broad Asset Class: =YCI("M:MNHRX", "broad_asset_class") |
| Broad Category: =YCI("M:MNHRX", "broad_category_group") |
| Prospectus Objective: =YCI("M:MNHRX", "prospectus_objective") |
| To find the codes for any of our securities and financial metrics, see our Complete Excel Reference. |