

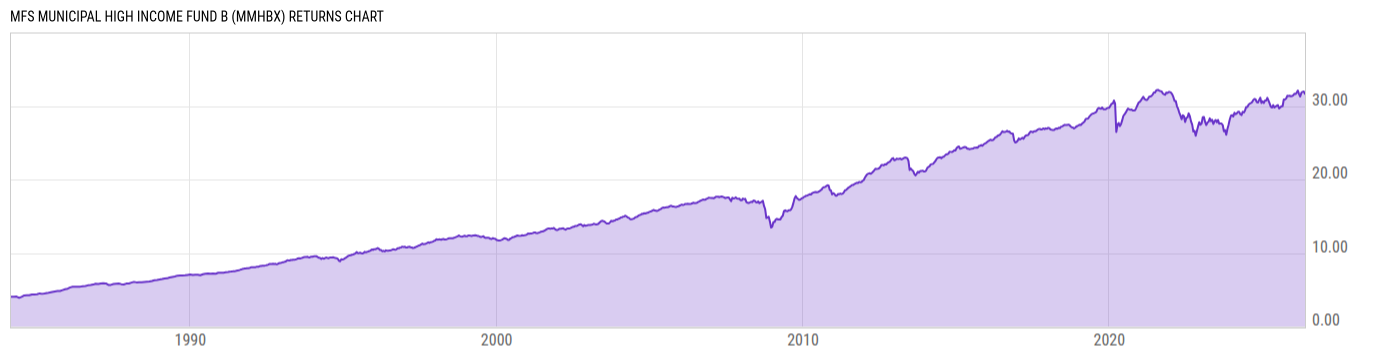
MFS Municipal High Income Fund B (MMHBX)
7.39
0.00 (0.00%)
USD |
May 22 2026
Returns Chart
Key Stats
| Net Expense Ratio | Total Assets Under Management | Weighted Average Dividend Yield | Turnover Ratio (Generic) |
|---|---|---|---|
| 1.41% | 5.538B | -- | 9.00% |
| 1 Year Fund Level Flows | 1 Year Total Returns (Daily) | Annualized Total Returns Since Inception (Daily) | Max Drawdown (Since Inception) |
| 301.21M | 6.37% |
Basic Info
| Investment Strategy | |
| The Fund seeks total return with an emphasis on high income exempt from federal income tax, but also considering capital appreciation. The Fund invests, under normal market conditions, at least 80% of its net assets in securities and other investments, the interest on which is exempt from federal income tax. |
| General | |
| Security Type | Mutual Fund |
| Equity Style | -- |
| Broad Asset Class | Municipal Bond |
| Broad Category | Fixed Income |
| Global Peer Group | Bond USD Municipal High Yield |
| Peer Group | High Yield Municipal Debt Funds |
| Global Macro | Bond High Yield |
| US Macro | National Municipal Debt Funds |
| YCharts Categorization | -- |
| YCharts Benchmark | -- |
| Prospectus Objective | High Yield Municipal Debt Funds |
| Fund Owner Firm Name | MFS |
| Broad Asset Class Benchmark Index | |
| ^BBMBTR | 100.0% |
Net Fund Flows Versus Peer Group
1 Month
% Rank:
37
-447.19M
Peer Group Low
391.76M
Peer Group High
1 Year
% Rank:
23
301.21M
-1.909B
Peer Group Low
2.560B
Peer Group High
3 Months
% Rank:
22
-444.70M
Peer Group Low
760.98M
Peer Group High
3 Years
% Rank:
34
-6.670B
Peer Group Low
6.954B
Peer Group High
6 Months
% Rank:
18
-871.28M
Peer Group Low
1.455B
Peer Group High
5 Years
% Rank:
85
-7.935B
Peer Group Low
10.29B
Peer Group High
YTD
% Rank:
27
-332.34M
Peer Group Low
931.64M
Peer Group High
10 Years
% Rank:
35
-4.571B
Peer Group Low
14.58B
Peer Group High
Date Unavailable
Risk
Performance Versus Peer Group
Annual Total Returns Versus Peers
As of May 23, 2026.
Asset Allocation
As of March 31, 2026.
| Type | % Net |
|---|---|
| Cash | 2.40% |
| Stock | 0.00% |
| Bond | 97.60% |
| Convertible | 0.00% |
| Preferred | 0.00% |
| Other | 0.00% |
Top 10 Holdings
| Name | % Weight | Price | % Change |
|---|---|---|---|
|
USD Cash
|
2.40% | -- | -- |
| PUERTO RICO SALES TAX FING CORP SALES TAX REV PR 5.000 07/01/2058 | 1.85% | 96.12 | 0.47% |
| BERKS CNTY PA MUN AUTH REV PA 5.000 06/30/2039 | 0.61% | 92.85 | 0.19% |
| BUCKEYE OHIO TOB SETTLEMENT FING AUTH OH 5.000 06/01/2055 | 0.60% | 78.82 | 0.41% |
| CALIFORNIA CMNTY CHOICE FING AUTH CLEAN ENERGY PROJ REV CA 5.250 01/01/2054 | 0.52% | 105.50 | 0.07% |
| NEW YORK TRANSN DEV CORP SPL FAC REV NY 5.125 06/30/2060 | 0.46% | 99.76 | 0.47% |
| CHICAGO ILL IL 5.000 01/01/2033 | 0.46% | 101.72 | 0.08% |
| NATIONAL FIN AUTH N H LEASE RENT REV NH 5.880 12/15/2038 | 0.45% | 103.86 | 0.12% |
| NEW YORK TRANSN DEV CORP SPL FAC REV NY 5.250 06/30/2060 | 0.44% | 100.88 | 0.18% |
| TOBACCO SETTLEMENT AUTH IOWA TOB SETTLEMENT REV IA 0.000 06/01/2065 | 0.40% | 13.34 | 1.21% |
Fees & Availability
| Fees | |
| Actual 12B-1 Fee | 1.00% |
| Actual Management Fee | 0.19% |
| Administration Fee | 83.00% |
| Maximum Front Load | -- |
| Maximum Deferred Load | 4.00% |
| Maximum Redemption Fee | 0.00% |
| General Availability | |
| Available for Insurance Product | No |
| Available for RRSP | No |
| Purchase Details | |
| Open to New Investors | No |
| Minimum Initial Investment | 1000.00 None |
| Minimum Subsequent Investment | 50.00 None |
Basic Info
| Investment Strategy | |
| The Fund seeks total return with an emphasis on high income exempt from federal income tax, but also considering capital appreciation. The Fund invests, under normal market conditions, at least 80% of its net assets in securities and other investments, the interest on which is exempt from federal income tax. |
| General | |
| Security Type | Mutual Fund |
| Equity Style | -- |
| Broad Asset Class | Municipal Bond |
| Broad Category | Fixed Income |
| Global Peer Group | Bond USD Municipal High Yield |
| Peer Group | High Yield Municipal Debt Funds |
| Global Macro | Bond High Yield |
| US Macro | National Municipal Debt Funds |
| YCharts Categorization | -- |
| YCharts Benchmark | -- |
| Prospectus Objective | High Yield Municipal Debt Funds |
| Fund Owner Firm Name | MFS |
| Broad Asset Class Benchmark Index | |
| ^BBMBTR | 100.0% |
Fundamentals
| General | |
| Distribution Yield | -- |
| Dividend Yield TTM (5-22-26) | 3.66% |
| 30-Day SEC Yield (4-30-26) | 3.73% |
| 7-Day SEC Yield | -- |
| Number of Holdings | 2047 |
| Bond | |
| Yield to Maturity (3-31-26) | 5.29% |
| Effective Duration | 8.29 |
| Average Coupon | 5.11% |
| Calculated Average Quality | 3.802 |
| Effective Maturity | 15.19 |
| Nominal Maturity | 21.58 |
| Number of Bond Holdings | 2001 |
As of March 31, 2026
Fund Details
Top Portfolio Holders
| Name | % Weight |
|---|---|
| Portfolio A | 5.00% |
| Portfolio B | 3.50% |
| Portfolio C | 2.25% |
Excel Add-In Codes
| Name: =YCI("M:MMHBX", "name") |
| Broad Asset Class: =YCI("M:MMHBX", "broad_asset_class") |
| Broad Category: =YCI("M:MMHBX", "broad_category_group") |
| Prospectus Objective: =YCI("M:MMHBX", "prospectus_objective") |
| To find the codes for any of our securities and financial metrics, see our Complete Excel Reference. |