

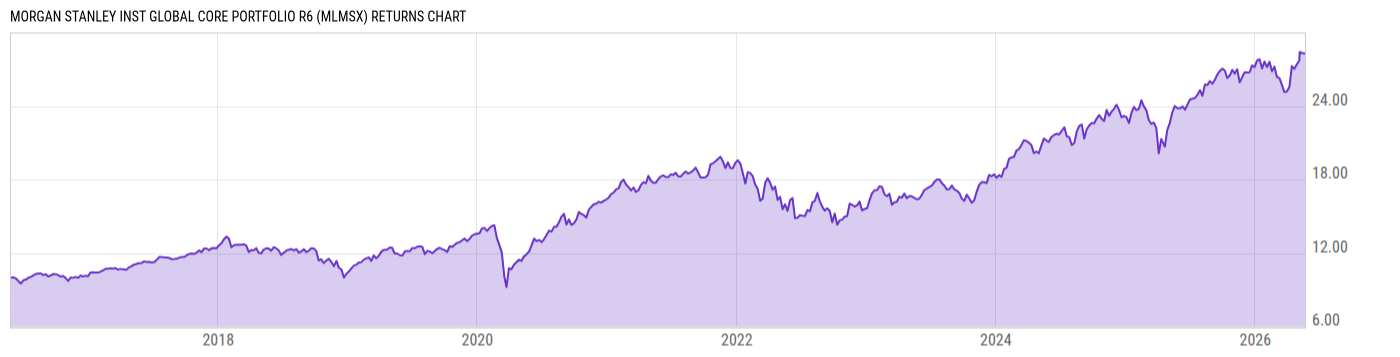
Morgan Stanley Inst Global Core Portfolio R6 (MLMSX)
25.03
+0.01
(+0.04%)
USD |
Jun 09 2026
Returns Chart
Key Stats
| Net Expense Ratio | Total Assets Under Management | Weighted Average Dividend Yield | Turnover Ratio (Generic) |
|---|---|---|---|
| 0.95% | 64.30M | 1.04% | 39.00% |
| 1 Year Fund Level Flows | 1 Year Total Returns (Daily) | Annualized Total Returns Since Inception (Daily) | Max Drawdown (Since Inception) |
| 12.57M | 16.85% |
Basic Info
| Investment Strategy | |
| The Fund seeks long-term capital appreciation. It invests primarily in U.S. and non-U.S. companies. The Adviser utilizes both a top-down and a bottom-up stock selection process, seeking investments in companies with attractive valuations, above average appreciation potential and competitive dividend yields. |
| General | |
| Security Type | Mutual Fund |
| Equity Style | Large Cap Growth |
| Broad Asset Class | International Equity |
| Broad Category | Equity |
| Global Peer Group | Equity Global |
| Peer Group | Global Large-Cap Growth |
| Global Macro | Equity Global |
| US Macro | Developed Global Markets Funds |
| YCharts Categorization | -- |
| YCharts Benchmark | -- |
| Prospectus Objective | Global Funds |
| Fund Owner Firm Name | Morgan Stanley |
| Broad Asset Class Benchmark Index | |
| ^MSACXUSNTR | 100.0% |
Net Fund Flows Versus Peer Group
1 Month
% Rank:
12
-692.03M
Peer Group Low
210.80M
Peer Group High
1 Year
% Rank:
9
12.57M
-8.255B
Peer Group Low
5.269B
Peer Group High
3 Months
% Rank:
17
-1.507B
Peer Group Low
658.44M
Peer Group High
3 Years
% Rank:
12
-19.14B
Peer Group Low
6.112B
Peer Group High
6 Months
% Rank:
18
-4.994B
Peer Group Low
1.590B
Peer Group High
5 Years
% Rank:
14
-28.64B
Peer Group Low
7.720B
Peer Group High
YTD
% Rank:
17
-2.889B
Peer Group Low
1.472B
Peer Group High
10 Years
% Rank:
35
-29.44B
Peer Group Low
7.720B
Peer Group High
Date Unavailable
Risk
Performance Versus Peer Group
Annual Total Returns Versus Peers
As of June 10, 2026.
Asset Allocation
As of March 31, 2026.
| Type | % Net |
|---|---|
| Cash | 0.01% |
| Stock | 99.46% |
| Bond | 0.53% |
| Convertible | 0.00% |
| Preferred | 0.00% |
| Other | 0.00% |
Top 10 Holdings
| Name | % Weight | Price | % Change |
|---|---|---|---|
| Alphabet, Inc. | 8.25% | 364.26 | 0.26% |
| NVIDIA Corp. | 7.29% | 208.19 | -0.22% |
| Taiwan Semiconductor Manufacturing Co., Ltd. | 6.88% | 427.92 | 0.26% |
| Apple, Inc. | 6.12% | 290.55 | -3.64% |
| Banco Santander SA | 5.31% | 12.27 | 0.90% |
| JPMorgan Chase & Co. | 5.26% | 312.70 | 0.51% |
| The TJX Cos., Inc. | 4.48% | 164.87 | 3.20% |
| CRH Plc | 4.19% | 103.70 | 2.14% |
| Sumitomo Mitsui Financial Group, Inc. | 3.94% | 23.07 | -0.73% |
| Amazon.com, Inc. | 3.59% | 244.19 | -0.42% |
Fees & Availability
| Fees | |
| Actual 12B-1 Fee | -- |
| Actual Management Fee | -- |
| Administration Fee | 12.00% |
| Maximum Front Load | -- |
| Maximum Deferred Load | -- |
| Maximum Redemption Fee | -- |
| General Availability | |
| Available for Insurance Product | No |
| Available for RRSP | No |
| Purchase Details | |
| Open to New Investors |
|
| Minimum Initial Investment | 10.00M None |
| Minimum Subsequent Investment | 0.00 None |
Basic Info
| Investment Strategy | |
| The Fund seeks long-term capital appreciation. It invests primarily in U.S. and non-U.S. companies. The Adviser utilizes both a top-down and a bottom-up stock selection process, seeking investments in companies with attractive valuations, above average appreciation potential and competitive dividend yields. |
| General | |
| Security Type | Mutual Fund |
| Equity Style | Large Cap Growth |
| Broad Asset Class | International Equity |
| Broad Category | Equity |
| Global Peer Group | Equity Global |
| Peer Group | Global Large-Cap Growth |
| Global Macro | Equity Global |
| US Macro | Developed Global Markets Funds |
| YCharts Categorization | -- |
| YCharts Benchmark | -- |
| Prospectus Objective | Global Funds |
| Fund Owner Firm Name | Morgan Stanley |
| Broad Asset Class Benchmark Index | |
| ^MSACXUSNTR | 100.0% |
Fundamentals
| General | |
| Distribution Yield | -- |
| Dividend Yield TTM (6-8-26) | 0.11% |
| 30-Day SEC Yield | -- |
| 7-Day SEC Yield | -- |
| Number of Holdings | 43 |
| Stock | |
| Weighted Average PE Ratio | 28.65 |
| Weighted Average Price to Sales Ratio | 7.397 |
| Weighted Average Price to Book Ratio | 10.90 |
| Weighted Median ROE | 63.46% |
| Weighted Median ROA | 17.80% |
| ROI (TTM) | 28.01% |
| Return on Investment (TTM) | 28.01% |
| Earning Yield | 0.0397 |
| LT Debt / Shareholders Equity | 0.7141 |
| Number of Equity Holdings | 41 |
As of March 31, 2026
Growth Metrics
| EPS Growth (1Y) | 29.43% |
| EPS Growth (3Y) | 30.36% |
| EPS Growth (5Y) | 33.27% |
| Sales Growth (1Y) | 16.54% |
| Sales Growth (3Y) | 17.68% |
| Sales Growth (5Y) | 16.36% |
| Sales per Share Growth (1Y) | 18.91% |
| Sales per Share Growth (3Y) | 19.28% |
| Operating Cash Flow - Growth Rate (3Y) | 30.05% |
As of March 31, 2026
Fund Details
Top Portfolio Holders
| Name | % Weight |
|---|---|
| Portfolio A | 5.00% |
| Portfolio B | 3.50% |
| Portfolio C | 2.25% |
Excel Add-In Codes
| Name: =YCI("M:MLMSX", "name") |
| Broad Asset Class: =YCI("M:MLMSX", "broad_asset_class") |
| Broad Category: =YCI("M:MLMSX", "broad_category_group") |
| Prospectus Objective: =YCI("M:MLMSX", "prospectus_objective") |
| To find the codes for any of our securities and financial metrics, see our Complete Excel Reference. |