

MFS Municipal Income Fund I (MIMIX)
8.08
0.00 (0.00%)
USD |
May 22 2026
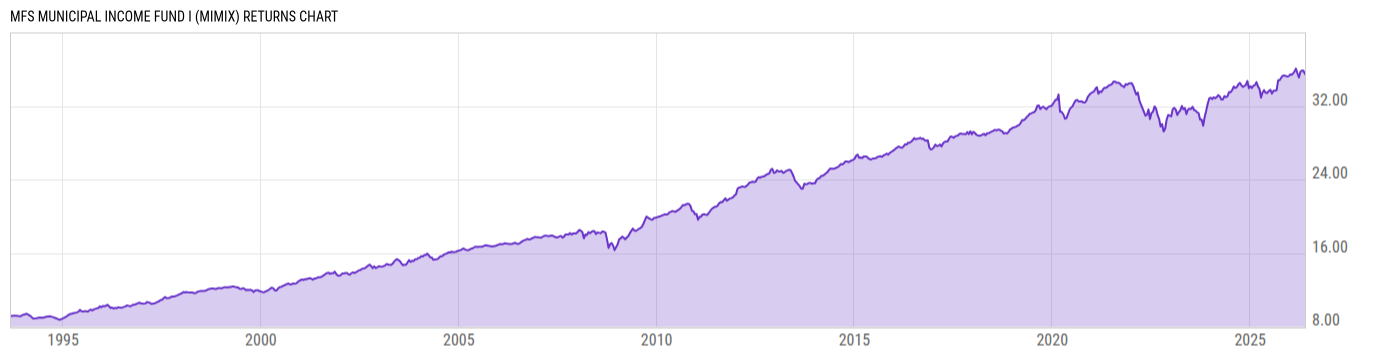
Returns Chart
Key Stats
| Net Expense Ratio | Total Assets Under Management | Weighted Average Dividend Yield | Turnover Ratio (Generic) |
|---|---|---|---|
| 0.51% | 7.004B | -- | 9.00% |
| 1 Year Fund Level Flows | 1 Year Total Returns (Daily) | Annualized Total Returns Since Inception (Daily) | Max Drawdown (Since Inception) |
| 928.87M | 6.41% |
Basic Info
| Investment Strategy | |
| The Fund seeks total return with an emphasis on income exempt from federal income tax, but also considering capital appreciation. The Fund, under normal market conditions, invests the funds assets in investment grade quality debt instruments, but may also invest in below investment grade quality debt instruments. |
| General | |
| Security Type | Mutual Fund |
| Equity Style | -- |
| Broad Asset Class | Municipal Bond |
| Broad Category | Fixed Income |
| Global Peer Group | Bond USD Municipal |
| Peer Group | General & Insured Municipal Debt Funds |
| Global Macro | Bond HC |
| US Macro | National Municipal Debt Funds |
| YCharts Categorization | -- |
| YCharts Benchmark | -- |
| Prospectus Objective | General & Insured Municipal Debt Funds |
| Fund Owner Firm Name | MFS |
| Broad Asset Class Benchmark Index | |
| ^BBMBTR | 100.0% |
Net Fund Flows Versus Peer Group
1 Month
% Rank:
27
-99.16M
Peer Group Low
809.96M
Peer Group High
1 Year
% Rank:
6
928.87M
-752.82M
Peer Group Low
6.079B
Peer Group High
3 Months
% Rank:
19
-397.00M
Peer Group Low
1.450B
Peer Group High
3 Years
% Rank:
11
-4.696B
Peer Group Low
16.26B
Peer Group High
6 Months
% Rank:
10
-636.26M
Peer Group Low
2.119B
Peer Group High
5 Years
% Rank:
13
-8.303B
Peer Group Low
33.26B
Peer Group High
YTD
% Rank:
8
-391.95M
Peer Group Low
1.826B
Peer Group High
10 Years
% Rank:
14
-7.392B
Peer Group Low
45.51B
Peer Group High
Date Unavailable
Risk
Performance Versus Peer Group
Annual Total Returns Versus Peers
As of May 23, 2026.
Asset Allocation
As of March 31, 2026.
| Type | % Net |
|---|---|
| Cash | 2.42% |
| Stock | 0.00% |
| Bond | 97.58% |
| Convertible | 0.00% |
| Preferred | 0.00% |
| Other | 0.00% |
Top 10 Holdings
| Name | % Weight | Price | % Change |
|---|---|---|---|
|
USD Cash
|
2.42% | -- | -- |
| BLACK BELT ENERGY GAS DIST ALA GAS PROJ REV AL 5.000 12/01/2034 | 0.53% | 104.05 | 0.14% |
| TEXAS MUN GAS ACQUISITION & SUPPLY CORP IV GAS SUPPLY REV TX 5.500 01/01/2054 | 0.47% | 108.24 | 0.11% |
| PRINCETON TEX INDPT SCH DIST TX 5.250 02/15/2055 | 0.43% | 103.51 | 0.14% |
| NEW YORK TRANSN DEV CORP SPL FAC REV NY 5.250 06/30/2060 | 0.42% | 100.88 | 0.18% |
| NEW YORK TRANSN DEV CORP SPL FAC REV NY 5.125 06/30/2060 | 0.42% | 99.76 | 0.47% |
| NATIONAL FIN AUTH N H LEASE RENT REV NH 5.880 12/15/2038 | 0.41% | 103.86 | 0.12% |
| CALIFORNIA CMNTY CHOICE FING AUTH CLEAN ENERGY PROJ REV CA 5.250 01/01/2054 | 0.41% | 105.50 | 0.07% |
| BLACK BELT ENERGY GAS DIST ALA GAS PROJ REV AL 5.500 10/01/2054 | 0.37% | 106.80 | 0.09% |
| NATIONAL FIN AUTH N H REV NH 5.500 06/01/2050 | 0.36% | 102.82 | 0.14% |
Fees & Availability
| Fees | |
| Actual 12B-1 Fee | -- |
| Actual Management Fee | 0.35% |
| Administration Fee | 227.3K% |
| Maximum Front Load | -- |
| Maximum Deferred Load | -- |
| Maximum Redemption Fee | -- |
| General Availability | |
| Available for Insurance Product | No |
| Available for RRSP | No |
| Purchase Details | |
| Open to New Investors |
|
| Minimum Initial Investment | 0.00 None |
| Minimum Subsequent Investment | 0.00 None |
Basic Info
| Investment Strategy | |
| The Fund seeks total return with an emphasis on income exempt from federal income tax, but also considering capital appreciation. The Fund, under normal market conditions, invests the funds assets in investment grade quality debt instruments, but may also invest in below investment grade quality debt instruments. |
| General | |
| Security Type | Mutual Fund |
| Equity Style | -- |
| Broad Asset Class | Municipal Bond |
| Broad Category | Fixed Income |
| Global Peer Group | Bond USD Municipal |
| Peer Group | General & Insured Municipal Debt Funds |
| Global Macro | Bond HC |
| US Macro | National Municipal Debt Funds |
| YCharts Categorization | -- |
| YCharts Benchmark | -- |
| Prospectus Objective | General & Insured Municipal Debt Funds |
| Fund Owner Firm Name | MFS |
| Broad Asset Class Benchmark Index | |
| ^BBMBTR | 100.0% |
Fundamentals
| General | |
| Distribution Yield | -- |
| Dividend Yield TTM (5-21-26) | 3.97% |
| 30-Day SEC Yield (4-30-26) | 4.10% |
| 7-Day SEC Yield | -- |
| Number of Holdings | 2286 |
| Bond | |
| Yield to Maturity (3-31-26) | 4.67% |
| Effective Duration | 8.52 |
| Average Coupon | 4.92% |
| Calculated Average Quality | 2.912 |
| Effective Maturity | 18.31 |
| Nominal Maturity | 21.97 |
| Number of Bond Holdings | 2232 |
As of March 31, 2026
Fund Details
Top Portfolio Holders
| Name | % Weight |
|---|---|
| Portfolio A | 5.00% |
| Portfolio B | 3.50% |
| Portfolio C | 2.25% |
Excel Add-In Codes
| Name: =YCI("M:MIMIX", "name") |
| Broad Asset Class: =YCI("M:MIMIX", "broad_asset_class") |
| Broad Category: =YCI("M:MIMIX", "broad_category_group") |
| Prospectus Objective: =YCI("M:MIMIX", "prospectus_objective") |
| To find the codes for any of our securities and financial metrics, see our Complete Excel Reference. |