

AMG Veritas China Fund I (MIMFX)
18.04
-0.50
(-2.70%)
USD |
Jun 10 2026
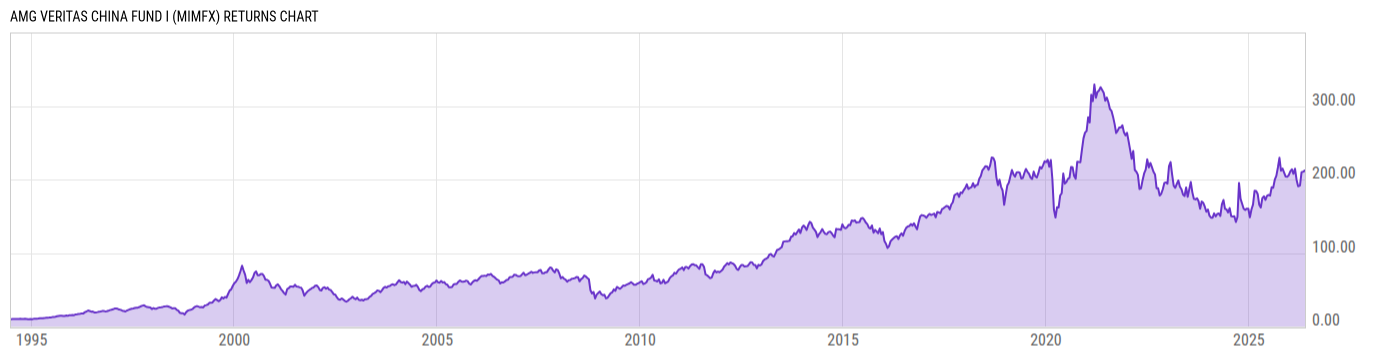
Returns Chart
Key Stats
| Net Expense Ratio | Total Assets Under Management | Weighted Average Dividend Yield | Turnover Ratio (Generic) |
|---|---|---|---|
| 0.93% | 42.56M | 1.24% | 84.00% |
| 1 Year Fund Level Flows | 1 Year Total Returns (Daily) | Annualized Total Returns Since Inception (Daily) | Max Drawdown (Since Inception) |
| -4.503M | 11.71% |
Basic Info
| Investment Strategy | |
| The Fund seeks long-term capital appreciation by investing in stocks of U.S. micro-cap companies, those with market capitalizations less than $550 million. Normally, the Fund will invest at least 80% of its total assets in these U.S. micro-cap stocks. |
| General | |
| Security Type | Mutual Fund |
| Equity Style | Large Cap Growth |
| Broad Asset Class | International Equity |
| Broad Category | Equity |
| Global Peer Group | Equity China |
| Peer Group | China Region Funds |
| Global Macro | Equity Emerging Markets |
| US Macro | Emerging Markets Equity Funds |
| YCharts Categorization | -- |
| YCharts Benchmark | -- |
| Prospectus Objective | China Region Funds |
| Fund Owner Firm Name | AMG |
| Broad Asset Class Benchmark Index | |
| ^MSACXUSNTR | 100.0% |
Net Fund Flows Versus Peer Group
1 Month
% Rank:
67
-299.76M
Peer Group Low
234.64M
Peer Group High
1 Year
% Rank:
72
-4.503M
-732.85M
Peer Group Low
1.157B
Peer Group High
3 Months
% Rank:
58
-659.56M
Peer Group Low
903.85M
Peer Group High
3 Years
% Rank:
67
-2.549B
Peer Group Low
1.536B
Peer Group High
6 Months
% Rank:
62
-872.15M
Peer Group Low
1.236B
Peer Group High
5 Years
% Rank:
76
-2.188B
Peer Group Low
2.110B
Peer Group High
YTD
% Rank:
62
-777.92M
Peer Group Low
1.292B
Peer Group High
10 Years
% Rank:
86
-1.215B
Peer Group Low
4.653B
Peer Group High
Date Unavailable
Risk
Performance Versus Peer Group
Annual Total Returns Versus Peers
As of June 11, 2026.
Asset Allocation
As of April 30, 2026.
| Type | % Net |
|---|---|
| Cash | 0.96% |
| Stock | 97.68% |
| Bond | 1.37% |
| Convertible | 0.00% |
| Preferred | 0.00% |
| Other | -0.01% |
Top 10 Holdings
| Name | % Weight | Price | % Change |
|---|---|---|---|
| Tencent Holdings Ltd. | 12.38% | 59.71 | 3.91% |
| Taiwan Semiconductor Manufacturing Co., Ltd. | 11.51% | 17.24 | 0.00% |
| Alibaba Group Holding Ltd. | 10.05% | 15.32 | 0.66% |
| Zijin Mining Group Co., Ltd. | 4.87% | 3.538 | -6.91% |
|
Contemporary Amperex Technology Co Ltd ORD
|
4.74% | -- | -- |
| Samsung Electronics Co., Ltd. | 3.95% | -- | -- |
|
Sieyuan Electric Co Ltd ORD
|
3.56% | -- | -- |
| Weichai Power Co., Ltd. | 2.76% | 4.56 | -2.98% |
| WuXi AppTec Co., Ltd. | 2.44% | 14.78 | 0.00% |
|
Naura Technology Group Co Ltd ORD
|
2.34% | -- | -- |
Fees & Availability
| Fees | |
| Actual 12B-1 Fee | -- |
| Actual Management Fee | 0.39% |
| Administration Fee | 6.53K% |
| Maximum Front Load | -- |
| Maximum Deferred Load | -- |
| Maximum Redemption Fee | -- |
| General Availability | |
| Available for Insurance Product | No |
| Available for RRSP | No |
| Purchase Details | |
| Open to New Investors |
|
| Minimum Initial Investment | 100000.0 None |
| Minimum Subsequent Investment | 100.00 None |
Basic Info
| Investment Strategy | |
| The Fund seeks long-term capital appreciation by investing in stocks of U.S. micro-cap companies, those with market capitalizations less than $550 million. Normally, the Fund will invest at least 80% of its total assets in these U.S. micro-cap stocks. |
| General | |
| Security Type | Mutual Fund |
| Equity Style | Large Cap Growth |
| Broad Asset Class | International Equity |
| Broad Category | Equity |
| Global Peer Group | Equity China |
| Peer Group | China Region Funds |
| Global Macro | Equity Emerging Markets |
| US Macro | Emerging Markets Equity Funds |
| YCharts Categorization | -- |
| YCharts Benchmark | -- |
| Prospectus Objective | China Region Funds |
| Fund Owner Firm Name | AMG |
| Broad Asset Class Benchmark Index | |
| ^MSACXUSNTR | 100.0% |
Fundamentals
| General | |
| Distribution Yield | -- |
| Dividend Yield TTM (6-10-26) | 0.50% |
| 30-Day SEC Yield | -- |
| 7-Day SEC Yield | -- |
| Number of Holdings | 42 |
| Stock | |
| Weighted Average PE Ratio | 29.71 |
| Weighted Average Price to Sales Ratio | 8.923 |
| Weighted Average Price to Book Ratio | 7.155 |
| Weighted Median ROE | 18.84% |
| Weighted Median ROA | 11.49% |
| ROI (TTM) | 15.97% |
| Return on Investment (TTM) | 15.97% |
| Earning Yield | 0.0423 |
| LT Debt / Shareholders Equity | 0.2057 |
| Number of Equity Holdings | 37 |
As of April 30, 2026
Growth Metrics
| EPS Growth (1Y) | 39.82% |
| EPS Growth (3Y) | 25.71% |
| EPS Growth (5Y) | 23.19% |
| Sales Growth (1Y) | 23.42% |
| Sales Growth (3Y) | 15.77% |
| Sales Growth (5Y) | 18.31% |
| Sales per Share Growth (1Y) | 24.84% |
| Sales per Share Growth (3Y) | 14.76% |
| Operating Cash Flow - Growth Rate (3Y) | 18.34% |
As of April 30, 2026
Fund Details
| Key Dates | |
| Inception Date | 6/30/1994 |
| Last Annual Report Date | 10/31/2025 |
| Last Prospectus Date | 3/1/2026 |
| Share Classes | |
| MMCFX | N |
| Attributes | |
| Index Fund | -- |
| Inverse Fund | No |
| Leveraged Fund | -- |
| Fund of Funds | No |
| Currency Hedged Fund | -- |
| Socially Responsible Fund | No |
Top Portfolio Holders
| Name | % Weight |
|---|---|
| Portfolio A | 5.00% |
| Portfolio B | 3.50% |
| Portfolio C | 2.25% |
Excel Add-In Codes
| Name: =YCI("M:MIMFX", "name") |
| Broad Asset Class: =YCI("M:MIMFX", "broad_asset_class") |
| Broad Category: =YCI("M:MIMFX", "broad_category_group") |
| Prospectus Objective: =YCI("M:MIMFX", "prospectus_objective") |
| To find the codes for any of our securities and financial metrics, see our Complete Excel Reference. |