

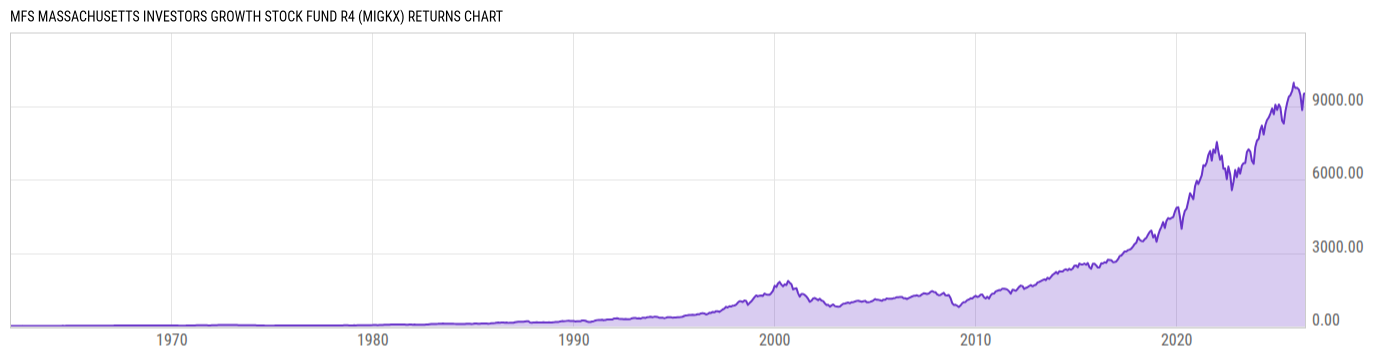
MFS Massachusetts Investors Growth Stock Fund R4 (MIGKX)
41.12
-0.10
(-0.24%)
USD |
May 21 2026
Returns Chart
Key Stats
| Net Expense Ratio | Total Assets Under Management | Weighted Average Dividend Yield | Turnover Ratio (Generic) |
|---|---|---|---|
| 0.46% | 9.136B | 0.92% | 21.00% |
| 1 Year Fund Level Flows | 1 Year Total Returns (Daily) | Annualized Total Returns Since Inception (Daily) | Max Drawdown (Since Inception) |
| -3.374B | 9.20% |
Basic Info
| Investment Strategy | |
| The Fund seeks to provide long-term capital growth and future income by keeping its assets invested, except for working cash balances, in the common stock or convertible securities of companies believed to have better-than-average prospects for long-term growth. |
| General | |
| Security Type | Mutual Fund |
| Equity Style | Large Cap Core |
| Broad Asset Class | US Equity |
| Broad Category | Equity |
| Global Peer Group | Equity US |
| Peer Group | Large-Cap Core Funds |
| Global Macro | Equity North America |
| US Macro | Large-Cap Funds |
| YCharts Categorization | -- |
| YCharts Benchmark | -- |
| Prospectus Objective | Growth & Income Funds |
| Fund Owner Firm Name | MFS |
| Broad Asset Class Benchmark Index | |
| ^SPXTR | 100.0% |
Net Fund Flows Versus Peer Group
1 Month
% Rank:
93
-5.233B
Peer Group Low
1.054B
Peer Group High
1 Year
% Rank:
94
-3.374B
-16.89B
Peer Group Low
12.11B
Peer Group High
3 Months
% Rank:
95
-9.978B
Peer Group Low
6.056B
Peer Group High
3 Years
% Rank:
93
-30.69B
Peer Group Low
26.39B
Peer Group High
6 Months
% Rank:
93
-12.73B
Peer Group Low
6.056B
Peer Group High
5 Years
% Rank:
92
-56.53B
Peer Group Low
26.35B
Peer Group High
YTD
% Rank:
93
-10.61B
Peer Group Low
6.056B
Peer Group High
10 Years
% Rank:
93
-136.53B
Peer Group Low
26.42B
Peer Group High
Date Unavailable
Risk
Performance Versus Peer Group
Annual Total Returns Versus Peers
As of May 22, 2026.
Asset Allocation
As of March 31, 2026.
| Type | % Net |
|---|---|
| Cash | 0.37% |
| Stock | 99.63% |
| Bond | 0.00% |
| Convertible | 0.00% |
| Preferred | 0.00% |
| Other | 0.00% |
Top 10 Holdings
| Name | % Weight | Price | % Change |
|---|---|---|---|
| NVIDIA Corp. | 11.54% | 215.52 | -1.82% |
| Microsoft Corp. | 10.09% | 418.65 | -0.10% |
| Alphabet, Inc. | 4.85% | 382.07 | -1.44% |
| Apple, Inc. | 4.69% | 308.26 | 1.07% |
| Taiwan Semiconductor Manufacturing Co., Ltd. | 4.32% | 404.26 | -0.71% |
| Amphenol Corp. | 3.54% | 132.35 | 6.00% |
| Visa, Inc. | 3.54% | 329.26 | -0.56% |
| Aon Plc | 2.74% | 324.30 | 0.02% |
| Hubbell, Inc. | 2.44% | 473.48 | 2.71% |
| CMS Energy Corp. | 2.34% | 74.58 | 1.28% |
Fees & Availability
| Fees | |
| Actual 12B-1 Fee | -- |
| Actual Management Fee | 0.33% |
| Administration Fee | 22.32K% |
| Maximum Front Load | -- |
| Maximum Deferred Load | -- |
| Maximum Redemption Fee | -- |
| General Availability | |
| Available for Insurance Product | No |
| Available for RRSP | No |
| Purchase Details | |
| Open to New Investors |
|
| Minimum Initial Investment | 0.00 None |
| Minimum Subsequent Investment | 0.00 None |
Basic Info
| Investment Strategy | |
| The Fund seeks to provide long-term capital growth and future income by keeping its assets invested, except for working cash balances, in the common stock or convertible securities of companies believed to have better-than-average prospects for long-term growth. |
| General | |
| Security Type | Mutual Fund |
| Equity Style | Large Cap Core |
| Broad Asset Class | US Equity |
| Broad Category | Equity |
| Global Peer Group | Equity US |
| Peer Group | Large-Cap Core Funds |
| Global Macro | Equity North America |
| US Macro | Large-Cap Funds |
| YCharts Categorization | -- |
| YCharts Benchmark | -- |
| Prospectus Objective | Growth & Income Funds |
| Fund Owner Firm Name | MFS |
| Broad Asset Class Benchmark Index | |
| ^SPXTR | 100.0% |
Fundamentals
| General | |
| Distribution Yield | -- |
| Dividend Yield TTM (5-20-26) | 0.73% |
| 30-Day SEC Yield | -- |
| 7-Day SEC Yield | -- |
| Number of Holdings | 56 |
| Stock | |
| Weighted Average PE Ratio | 29.47 |
| Weighted Average Price to Sales Ratio | 8.583 |
| Weighted Average Price to Book Ratio | 11.15 |
| Weighted Median ROE | 55.07% |
| Weighted Median ROA | 21.99% |
| ROI (TTM) | 29.21% |
| Return on Investment (TTM) | 29.21% |
| Earning Yield | 0.0357 |
| LT Debt / Shareholders Equity | 0.7087 |
| Number of Equity Holdings | 54 |
As of March 31, 2026
Growth Metrics
| EPS Growth (1Y) | 25.03% |
| EPS Growth (3Y) | 25.51% |
| EPS Growth (5Y) | 27.87% |
| Sales Growth (1Y) | 19.31% |
| Sales Growth (3Y) | 20.50% |
| Sales Growth (5Y) | 18.52% |
| Sales per Share Growth (1Y) | 20.87% |
| Sales per Share Growth (3Y) | 22.55% |
| Operating Cash Flow - Growth Rate (3Y) | 34.18% |
As of March 31, 2026
Fund Details
| Key Dates | |
| Inception Date | 1/1/1935 |
| Last Annual Report Date | 11/30/2025 |
| Last Prospectus Date | 3/28/2025 |
| Share Classes | |
| MGTIX | Inst |
| MIGBX | B |
| MIGDX | C |
| MIGFX | A |
| MIGHX | Retirement |
| MIGMX | Retirement |
| MIGNX | Retirement |
| MIRGX | Retirement |
| Attributes | |
| Index Fund | -- |
| Inverse Fund | No |
| Leveraged Fund | -- |
| Fund of Funds | No |
| Currency Hedged Fund | -- |
| Socially Responsible Fund | No |
Top Portfolio Holders
| Name | % Weight |
|---|---|
| Portfolio A | 5.00% |
| Portfolio B | 3.50% |
| Portfolio C | 2.25% |
Excel Add-In Codes
| Name: =YCI("M:MIGKX", "name") |
| Broad Asset Class: =YCI("M:MIGKX", "broad_asset_class") |
| Broad Category: =YCI("M:MIGKX", "broad_category_group") |
| Prospectus Objective: =YCI("M:MIGKX", "prospectus_objective") |
| To find the codes for any of our securities and financial metrics, see our Complete Excel Reference. |