

MFS Global High Yield Fund R4 (MHOUX)
5.71
0.00 (0.00%)
USD |
Jun 09 2026
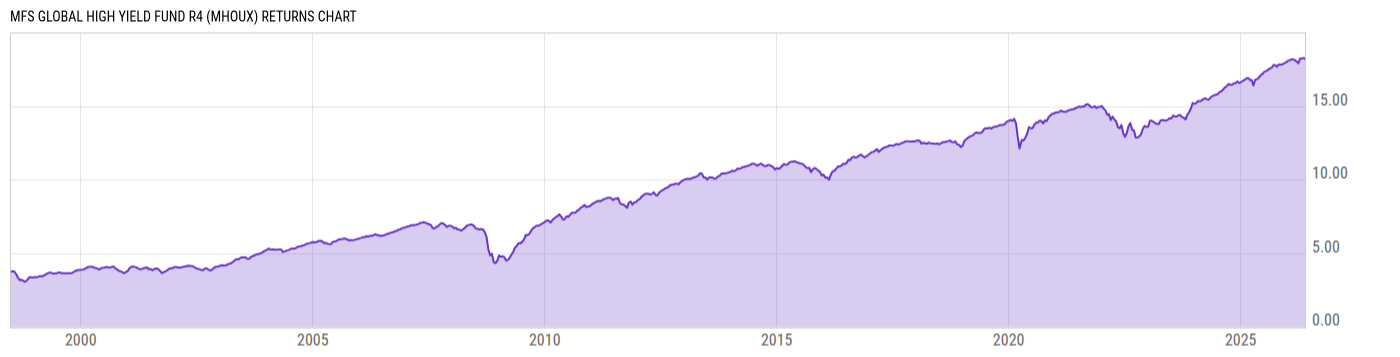
Returns Chart
Key Stats
| Net Expense Ratio | Total Assets Under Management | Weighted Average Dividend Yield | Turnover Ratio (Generic) |
|---|---|---|---|
| 0.78% | 180.33M | -- | 38.00% |
| 1 Year Fund Level Flows | 1 Year Total Returns (Daily) | Annualized Total Returns Since Inception (Daily) | Max Drawdown (Since Inception) |
| -26.41M | 6.85% |
Basic Info
| Investment Strategy | |
| The Fund seeks total return with an emphasis on high current income, but also considering capital appreciation. The Fund normally invests directly and/or indirectly through investment in mutual funds advised by the investment adviser at least 80% of the funds net assets in high income debt instruments. |
| General | |
| Security Type | Mutual Fund |
| Equity Style | -- |
| Broad Asset Class | Taxable Bond |
| Broad Category | Fixed Income |
| Global Peer Group | Bond Global High Yield USD |
| Peer Group | Global High Yield Funds |
| Global Macro | Bond High Yield |
| US Macro | High Yield Funds |
| YCharts Categorization | -- |
| YCharts Benchmark | -- |
| Prospectus Objective | Global High Yield Funds |
| Fund Owner Firm Name | MFS |
| Broad Asset Class Benchmark Index | |
| ^BBUSATR | 100.0% |
Net Fund Flows Versus Peer Group
1 Month
% Rank:
72
-102.99M
Peer Group Low
269.98M
Peer Group High
1 Year
% Rank:
70
-26.41M
-208.83M
Peer Group Low
269.98M
Peer Group High
3 Months
% Rank:
69
-140.79M
Peer Group Low
269.98M
Peer Group High
3 Years
% Rank:
70
-1.177B
Peer Group Low
1.062B
Peer Group High
6 Months
% Rank:
39
-491.00M
Peer Group Low
269.98M
Peer Group High
5 Years
% Rank:
75
-2.590B
Peer Group Low
2.289B
Peer Group High
YTD
% Rank:
39
-303.35M
Peer Group Low
269.98M
Peer Group High
10 Years
% Rank:
67
-5.038B
Peer Group Low
2.289B
Peer Group High
Date Unavailable
Risk
Performance Versus Peer Group
Annual Total Returns Versus Peers
As of June 10, 2026.
Asset Allocation
As of April 30, 2026.
| Type | % Net |
|---|---|
| Cash | 2.00% |
| Stock | 0.00% |
| Bond | 32.52% |
| Convertible | 0.00% |
| Preferred | 0.00% |
| Other | 65.48% |
Top 10 Holdings
| Name | % Weight | Price | % Change |
|---|---|---|---|
|
MFS High Yield Pooled Portfolio
|
65.38% | -- | -- |
|
USD/EUR Forward Contract
|
14.48% | -- | -- |
|
USD/GBP Forward Contract
|
2.29% | -- | -- |
|
USD Cash
|
2.00% | -- | -- |
|
USD/CAD Forward Contract
|
0.64% | -- | -- |
| Samarco Mineracao S.A. SAMRCO 4.0 06/30/2031 VAR USD Corporate RegS | 0.62% | 101.20 | 0.05% |
|
Bulgarian Energy Holding EAD 22-JUL-2028
|
0.62% | -- | -- |
| GRUPO NUTRESA S.A. GRUPONU 8.0 05/12/2030 FIX USD Corporate 144A | 0.54% | 105.66 | -0.18% |
| SASOL FINANCING USA LLC SASOFIN 5.5 03/18/2031 FIX USD Corporate | 0.53% | 95.02 | 0.08% |
| Petroleos Mexicanos PEMEX 6.5 06/02/2041 FIX USD Corporate | 0.53% | 89.80 | 0.16% |
Fees & Availability
| Fees | |
| Actual 12B-1 Fee | -- |
| Actual Management Fee | 0.42% |
| Administration Fee | 383.0% |
| Maximum Front Load | -- |
| Maximum Deferred Load | -- |
| Maximum Redemption Fee | -- |
| General Availability | |
| Available for Insurance Product | No |
| Available for RRSP | No |
| Purchase Details | |
| Open to New Investors |
|
| Minimum Initial Investment | 0.00 None |
| Minimum Subsequent Investment | 0.00 None |
Basic Info
| Investment Strategy | |
| The Fund seeks total return with an emphasis on high current income, but also considering capital appreciation. The Fund normally invests directly and/or indirectly through investment in mutual funds advised by the investment adviser at least 80% of the funds net assets in high income debt instruments. |
| General | |
| Security Type | Mutual Fund |
| Equity Style | -- |
| Broad Asset Class | Taxable Bond |
| Broad Category | Fixed Income |
| Global Peer Group | Bond Global High Yield USD |
| Peer Group | Global High Yield Funds |
| Global Macro | Bond High Yield |
| US Macro | High Yield Funds |
| YCharts Categorization | -- |
| YCharts Benchmark | -- |
| Prospectus Objective | Global High Yield Funds |
| Fund Owner Firm Name | MFS |
| Broad Asset Class Benchmark Index | |
| ^BBUSATR | 100.0% |
Fundamentals
| General | |
| Distribution Yield | -- |
| Dividend Yield TTM (6-8-26) | 5.27% |
| 30-Day SEC Yield (4-30-26) | 6.15% |
| 7-Day SEC Yield | -- |
| Number of Holdings | 129 |
Fund Details
| Key Dates | |
| Inception Date | 6/2/2008 |
| Last Annual Report Date | 1/31/2026 |
| Last Prospectus Date | 8/1/2025 |
| Share Classes | |
| MHOAX | A |
| MHOBX | B |
| MHOCX | C |
| MHOIX | Inst |
| MHORX | Retirement |
| MHOSX | Retirement |
| MHOTX | Retirement |
| MHOVX | Retirement |
| Attributes | |
| Index Fund | -- |
| Inverse Fund | No |
| Leveraged Fund | -- |
| Fund of Funds | No |
| Currency Hedged Fund | -- |
| Socially Responsible Fund | No |
Top Portfolio Holders
| Name | % Weight |
|---|---|
| Portfolio A | 5.00% |
| Portfolio B | 3.50% |
| Portfolio C | 2.25% |
Excel Add-In Codes
| Name: =YCI("M:MHOUX", "name") |
| Broad Asset Class: =YCI("M:MHOUX", "broad_asset_class") |
| Broad Category: =YCI("M:MHOUX", "broad_category_group") |
| Prospectus Objective: =YCI("M:MHOUX", "prospectus_objective") |
| To find the codes for any of our securities and financial metrics, see our Complete Excel Reference. |