

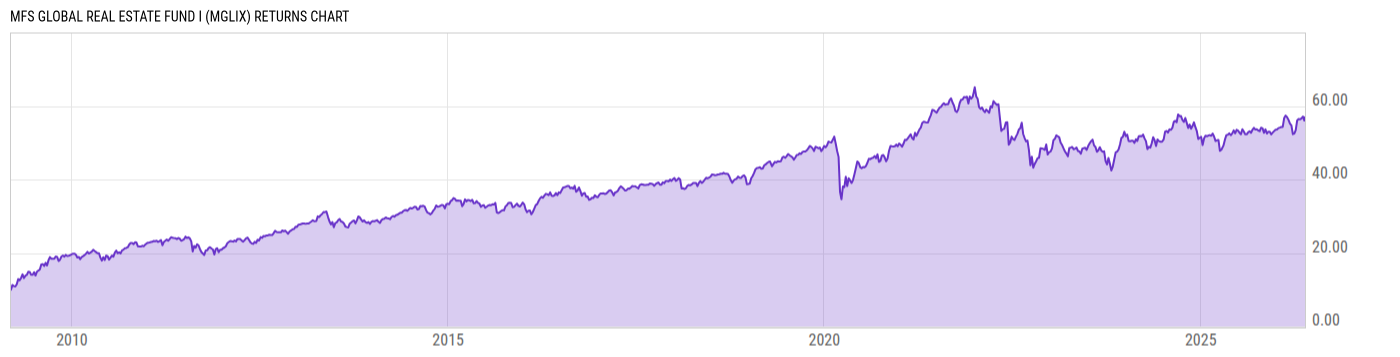
MFS Global Real Estate Fund I (MGLIX)
17.35
+0.34
(+2.00%)
USD |
Jun 09 2026
Returns Chart
Key Stats
| Net Expense Ratio | Total Assets Under Management | Weighted Average Dividend Yield | Turnover Ratio (Generic) |
|---|---|---|---|
| 0.93% | 2.160B | 3.68% | 35.00% |
| 1 Year Fund Level Flows | 1 Year Total Returns (Daily) | Annualized Total Returns Since Inception (Daily) | Max Drawdown (Since Inception) |
| -318.79M | 8.38% |
Basic Info
| Investment Strategy | |
| The Fund seeks total return. The Fund invests at least 80% of its net assets in U.S. and foreign real estate-related investments. MFS normally allocates the funds investments across different REIT managers and property types, but may from time to time focus the funds investments in any one or a few of these areas. |
| General | |
| Security Type | Mutual Fund |
| Equity Style | Multi Cap Value |
| Broad Asset Class | Sector Equity |
| Broad Category | Equity |
| Global Peer Group | Equity Sector Real Estate Global |
| Peer Group | Global Real Estate Funds |
| Global Macro | Equity Real Estate |
| US Macro | World Sector Equity Funds |
| YCharts Categorization | -- |
| YCharts Benchmark | -- |
| Prospectus Objective | Global Real Estate Funds |
| Fund Owner Firm Name | MFS |
| Broad Asset Class Benchmark Index | |
| ^MSWNTR | 100.0% |
Net Fund Flows Versus Peer Group
1 Month
% Rank:
97
-51.84M
Peer Group Low
172.90M
Peer Group High
1 Year
% Rank:
98
-318.79M
-318.79M
Peer Group Low
2.126B
Peer Group High
3 Months
% Rank:
93
-235.65M
Peer Group Low
2.126B
Peer Group High
3 Years
% Rank:
92
-2.467B
Peer Group Low
2.461B
Peer Group High
6 Months
% Rank:
98
-202.45M
Peer Group Low
2.126B
Peer Group High
5 Years
% Rank:
60
-2.920B
Peer Group Low
2.958B
Peer Group High
YTD
% Rank:
98
-183.58M
Peer Group Low
2.126B
Peer Group High
10 Years
% Rank:
6
-3.011B
Peer Group Low
3.342B
Peer Group High
Date Unavailable
Risk
Performance Versus Peer Group
Annual Total Returns Versus Peers
As of June 11, 2026.
Asset Allocation
As of April 30, 2026.
| Type | % Net |
|---|---|
| Cash | 0.20% |
| Stock | 99.55% |
| Bond | 0.00% |
| Convertible | 0.00% |
| Preferred | 0.00% |
| Other | 0.25% |
Top 10 Holdings
| Name | % Weight | Price | % Change |
|---|---|---|---|
| Prologis, Inc. | 8.42% | 145.77 | -1.19% |
| Equinix, Inc. | 5.96% | 1038.33 | -2.03% |
| Ventas, Inc. | 4.09% | 84.35 | 2.28% |
| Digital Realty Trust, Inc. | 4.01% | 180.78 | -2.24% |
| Simon Property Group, Inc. | 3.94% | 212.82 | 0.44% |
| Goodman Group | 3.93% | 21.88 | 0.00% |
| Mitsubishi Estate Co., Ltd. | 3.42% | 25.15 | 0.00% |
| Unibail-Rodamco-Westfield SE | 2.51% | 109.73 | 0.00% |
| Equity LifeStyle Properties, Inc. | 2.28% | 64.32 | 1.52% |
| Scentre Group | 2.07% | 2.85 | 0.00% |
Fees & Availability
| Fees | |
| Actual 12B-1 Fee | -- |
| Actual Management Fee | 0.80% |
| Administration Fee | 123.4K% |
| Maximum Front Load | -- |
| Maximum Deferred Load | -- |
| Maximum Redemption Fee | -- |
| General Availability | |
| Available for Insurance Product | No |
| Available for RRSP | No |
| Purchase Details | |
| Open to New Investors |
|
| Minimum Initial Investment | 0.00 None |
| Minimum Subsequent Investment | 0.00 None |
Basic Info
| Investment Strategy | |
| The Fund seeks total return. The Fund invests at least 80% of its net assets in U.S. and foreign real estate-related investments. MFS normally allocates the funds investments across different REIT managers and property types, but may from time to time focus the funds investments in any one or a few of these areas. |
| General | |
| Security Type | Mutual Fund |
| Equity Style | Multi Cap Value |
| Broad Asset Class | Sector Equity |
| Broad Category | Equity |
| Global Peer Group | Equity Sector Real Estate Global |
| Peer Group | Global Real Estate Funds |
| Global Macro | Equity Real Estate |
| US Macro | World Sector Equity Funds |
| YCharts Categorization | -- |
| YCharts Benchmark | -- |
| Prospectus Objective | Global Real Estate Funds |
| Fund Owner Firm Name | MFS |
| Broad Asset Class Benchmark Index | |
| ^MSWNTR | 100.0% |
Fundamentals
| General | |
| Distribution Yield | -- |
| Dividend Yield TTM (6-8-26) | 3.00% |
| 30-Day SEC Yield | -- |
| 7-Day SEC Yield | -- |
| Number of Holdings | 65 |
| Stock | |
| Weighted Average PE Ratio | 30.40 |
| Weighted Average Price to Sales Ratio | 9.543 |
| Weighted Average Price to Book Ratio | 2.967 |
| Weighted Median ROE | 12.75% |
| Weighted Median ROA | 4.13% |
| ROI (TTM) | 11.42% |
| Return on Investment (TTM) | 11.42% |
| Earning Yield | 0.0466 |
| LT Debt / Shareholders Equity | 1.002 |
| Number of Equity Holdings | 54 |
As of April 30, 2026
Growth Metrics
| EPS Growth (1Y) | 35.32% |
| EPS Growth (3Y) | 10.42% |
| EPS Growth (5Y) | 6.99% |
| Sales Growth (1Y) | 7.16% |
| Sales Growth (3Y) | 7.73% |
| Sales Growth (5Y) | 10.11% |
| Sales per Share Growth (1Y) | 4.10% |
| Sales per Share Growth (3Y) | 4.34% |
| Operating Cash Flow - Growth Rate (3Y) | 6.36% |
As of April 30, 2026
Fund Details
| Key Dates | |
| Inception Date | 3/11/2009 |
| Last Annual Report Date | 8/31/2025 |
| Last Prospectus Date | 12/30/2025 |
| Share Classes | |
| MGLAX | A |
| MGLCX | C |
| MGLDX | B |
| MGLJX | Retirement |
| MGLKX | Retirement |
| MGLLX | Retirement |
| MGLMX | Retirement |
| MGLRX | Retirement |
| Attributes | |
| Index Fund | -- |
| Inverse Fund | No |
| Leveraged Fund | -- |
| Fund of Funds | No |
| Currency Hedged Fund | -- |
| Socially Responsible Fund | No |
Top Portfolio Holders
| Name | % Weight |
|---|---|
| Portfolio A | 5.00% |
| Portfolio B | 3.50% |
| Portfolio C | 2.25% |
Excel Add-In Codes
| Name: =YCI("M:MGLIX", "name") |
| Broad Asset Class: =YCI("M:MGLIX", "broad_asset_class") |
| Broad Category: =YCI("M:MGLIX", "broad_category_group") |
| Prospectus Objective: =YCI("M:MGLIX", "prospectus_objective") |
| To find the codes for any of our securities and financial metrics, see our Complete Excel Reference. |