

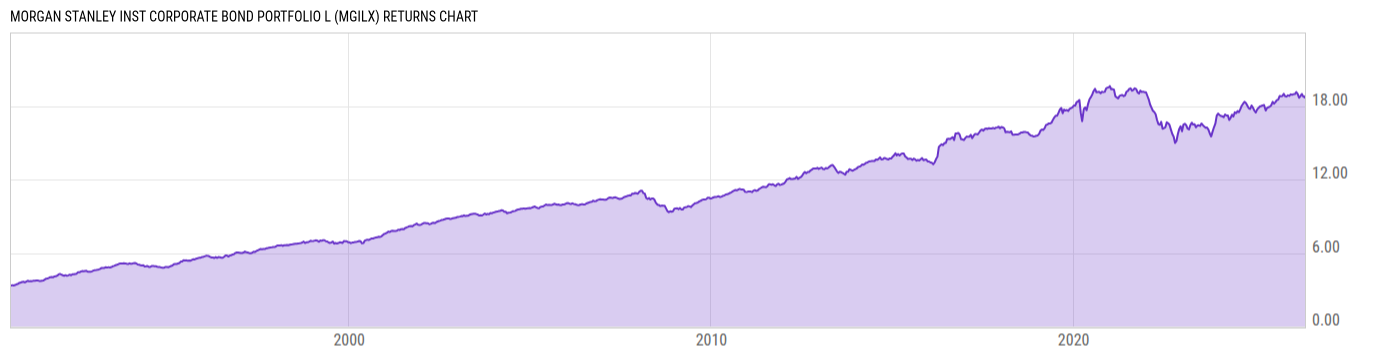
Morgan Stanley Inst Corporate Bond Portfolio L (MGILX)
10.54
+0.03
(+0.29%)
USD |
Jun 09 2026
Returns Chart
Key Stats
| Net Expense Ratio | Total Assets Under Management | Weighted Average Dividend Yield | Turnover Ratio (Generic) |
|---|---|---|---|
| 1.48% | 156.81M | -- | 117.0% |
| 1 Year Fund Level Flows | 1 Year Total Returns (Daily) | Annualized Total Returns Since Inception (Daily) | Max Drawdown (Since Inception) |
| 26.04M | 4.67% |
Basic Info
| Investment Strategy | |
| The Fund seeks above-average total return over a market cycle of three to five years. The Fund invests at least 80% of the Funds assets in corporate bonds. It invests primarily in US corporate bonds that carry an investment grade rating or, if unrated, considered by the Adviser to be of equivalent quality. |
| General | |
| Security Type | Mutual Fund |
| Equity Style | -- |
| Broad Asset Class | Taxable Bond |
| Broad Category | Fixed Income |
| Global Peer Group | Bond USD Corporates |
| Peer Group | Corporate Debt Funds BBB-Rated |
| Global Macro | Bond Corporates |
| US Macro | General Domestic Taxable Fixed Income Funds |
| YCharts Categorization | -- |
| YCharts Benchmark | -- |
| Prospectus Objective | Corporate Debt Funds BBB-Rated |
| Fund Owner Firm Name | Morgan Stanley |
| Broad Asset Class Benchmark Index | |
| ^BBUSATR | 100.0% |
Net Fund Flows Versus Peer Group
1 Month
% Rank:
53
-1.441B
Peer Group Low
748.99M
Peer Group High
1 Year
% Rank:
36
26.04M
-3.244B
Peer Group Low
12.80B
Peer Group High
3 Months
% Rank:
29
-1.908B
Peer Group Low
1.681B
Peer Group High
3 Years
% Rank:
48
-9.856B
Peer Group Low
25.39B
Peer Group High
6 Months
% Rank:
27
-3.368B
Peer Group Low
8.887B
Peer Group High
5 Years
% Rank:
55
-10.18B
Peer Group Low
26.92B
Peer Group High
YTD
% Rank:
25
-471.58M
Peer Group Low
7.655B
Peer Group High
10 Years
% Rank:
55
-8.640B
Peer Group Low
62.93B
Peer Group High
Date Unavailable
Risk
Performance Versus Peer Group
Annual Total Returns Versus Peers
As of June 10, 2026.
Asset Allocation
As of April 30, 2026.
| Type | % Net |
|---|---|
| Cash | 0.76% |
| Stock | 0.00% |
| Bond | 98.71% |
| Convertible | 0.00% |
| Preferred | 0.03% |
| Other | 0.49% |
Top 10 Holdings
| Name | % Weight | Price | % Change |
|---|---|---|---|
|
2YR T-NOTE JUN26
|
14.03% | -- | -- |
|
US T BONDS JUN26
|
10.46% | -- | -- |
| Bank of America Corporation BACORP 5.872 09/15/2034 FLT USD Corporate '33 | 1.98% | 104.14 | 0.23% |
| JPMorgan Chase & Co. JPM 5.766 04/22/2035 FLT USD Corporate '34 | 1.92% | 103.59 | 0.26% |
| Oracle Corporation ORCLE 5.7 02/04/2036 FIX USD Corporate | 0.97% | 97.06 | 0.12% |
| Wells Fargo & Company WFC 5.557 07/25/2034 FLT USD Corporate '33 | 0.84% | 102.08 | 0.23% |
| Verizon Communications Inc. VRZN 2.355 03/15/2032 FIX USD Corporate | 0.82% | 87.22 | 0.16% |
| The Goldman Sachs Group, Inc. GS 5.33 07/23/2035 FLT USD Corporate '34 | 0.79% | 99.91 | 0.21% |
| ONEOK, INC. OKE 5.4 10/15/2035 FIX USD Corporate | 0.78% | 99.49 | 0.27% |
| Morgan Stanley Inst Liq Govt Port Institutional | 0.77% | 1.00 | 0.00% |
Fees & Availability
| Fees | |
| Actual 12B-1 Fee | 0.50% |
| Actual Management Fee | 0.18% |
| Administration Fee | 667.0% |
| Maximum Front Load | -- |
| Maximum Deferred Load | -- |
| Maximum Redemption Fee | 0.00% |
| General Availability | |
| Available for Insurance Product | No |
| Available for RRSP | No |
| Purchase Details | |
| Open to New Investors | No |
| Minimum Initial Investment | 1000.00 None |
| Minimum Subsequent Investment | 0.00 None |
Basic Info
| Investment Strategy | |
| The Fund seeks above-average total return over a market cycle of three to five years. The Fund invests at least 80% of the Funds assets in corporate bonds. It invests primarily in US corporate bonds that carry an investment grade rating or, if unrated, considered by the Adviser to be of equivalent quality. |
| General | |
| Security Type | Mutual Fund |
| Equity Style | -- |
| Broad Asset Class | Taxable Bond |
| Broad Category | Fixed Income |
| Global Peer Group | Bond USD Corporates |
| Peer Group | Corporate Debt Funds BBB-Rated |
| Global Macro | Bond Corporates |
| US Macro | General Domestic Taxable Fixed Income Funds |
| YCharts Categorization | -- |
| YCharts Benchmark | -- |
| Prospectus Objective | Corporate Debt Funds BBB-Rated |
| Fund Owner Firm Name | Morgan Stanley |
| Broad Asset Class Benchmark Index | |
| ^BBUSATR | 100.0% |
Fundamentals
| General | |
| Distribution Yield | -- |
| Dividend Yield TTM (6-8-26) | 3.76% |
| 30-Day SEC Yield (4-30-26) | 3.89% |
| 7-Day SEC Yield | -- |
| Number of Holdings | 316 |
| Bond | |
| Yield to Maturity (4-30-26) | 5.37% |
| Effective Duration | -- |
| Average Coupon | 5.35% |
| Calculated Average Quality | 3.691 |
| Effective Maturity | 11.74 |
| Nominal Maturity | 12.24 |
| Number of Bond Holdings | 289 |
As of April 30, 2026
Fund Details
Top Portfolio Holders
| Name | % Weight |
|---|---|
| Portfolio A | 5.00% |
| Portfolio B | 3.50% |
| Portfolio C | 2.25% |
Excel Add-In Codes
| Name: =YCI("M:MGILX", "name") |
| Broad Asset Class: =YCI("M:MGILX", "broad_asset_class") |
| Broad Category: =YCI("M:MGILX", "broad_category_group") |
| Prospectus Objective: =YCI("M:MGILX", "prospectus_objective") |
| To find the codes for any of our securities and financial metrics, see our Complete Excel Reference. |