

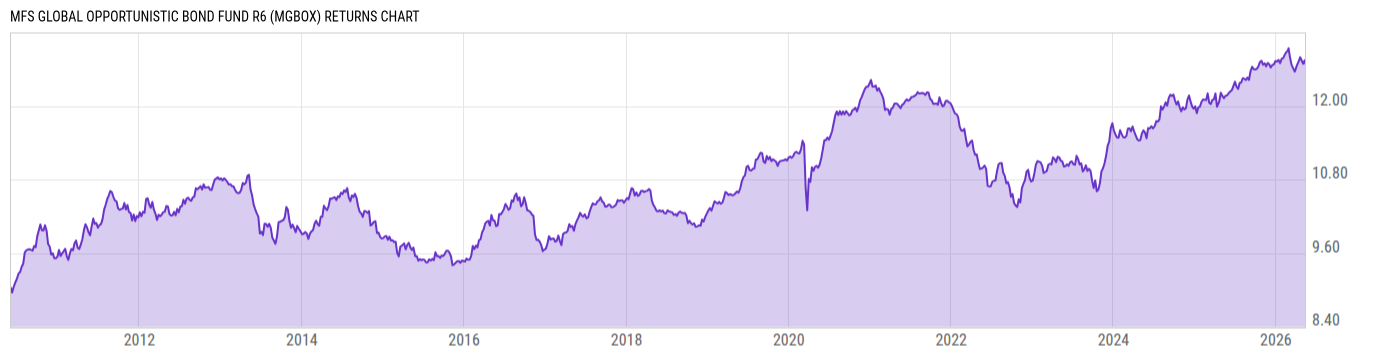
MFS Global Opportunistic Bond Fund R6 (MGBOX)
8.12
+0.01
(+0.12%)
USD |
Jun 02 2026
Returns Chart
Key Stats
| Net Expense Ratio | Total Assets Under Management | Weighted Average Dividend Yield | Turnover Ratio (Generic) |
|---|---|---|---|
| 0.61% | 1.024B | -- | 133.0% |
| 1 Year Fund Level Flows | 1 Year Total Returns (Daily) | Annualized Total Returns Since Inception (Daily) | Max Drawdown (Since Inception) |
| 14.93M | 4.86% |
Basic Info
| Investment Strategy | |
| The Fund seeks total return with an emphasis on current income, but also considering capital appreciation. The Fund invests at least 80% of its assets in debt instruments of U.S. and foreign issuers, including emerging markets issuers. The Fund generally focuses on debt instruments of U.S. and foreign governments. |
| General | |
| Security Type | Mutual Fund |
| Equity Style | -- |
| Broad Asset Class | Taxable Bond |
| Broad Category | Fixed Income |
| Global Peer Group | Bond Global USD |
| Peer Group | Global Income Funds |
| Global Macro | Bond Global |
| US Macro | World Income Funds |
| YCharts Categorization | -- |
| YCharts Benchmark | -- |
| Prospectus Objective | Global Income Funds |
| Fund Owner Firm Name | MFS |
| Broad Asset Class Benchmark Index | |
| ^BBUSATR | 100.0% |
Net Fund Flows Versus Peer Group
1 Month
% Rank:
42
-312.18M
Peer Group Low
294.12M
Peer Group High
1 Year
% Rank:
37
14.93M
-1.119B
Peer Group Low
1.537B
Peer Group High
3 Months
% Rank:
78
-333.34M
Peer Group Low
571.67M
Peer Group High
3 Years
% Rank:
57
-2.542B
Peer Group Low
2.741B
Peer Group High
6 Months
% Rank:
77
-731.75M
Peer Group Low
783.93M
Peer Group High
5 Years
% Rank:
24
-8.824B
Peer Group Low
3.313B
Peer Group High
YTD
% Rank:
76
-469.47M
Peer Group Low
717.27M
Peer Group High
10 Years
% Rank:
31
-48.28B
Peer Group Low
4.548B
Peer Group High
Date Unavailable
Risk
Performance Versus Peer Group
Annual Total Returns Versus Peers
As of June 03, 2026.
Asset Allocation
As of April 30, 2026.
| Type | % Net |
|---|---|
| Cash | 1.80% |
| Stock | 0.00% |
| Bond | 97.87% |
| Convertible | 0.00% |
| Preferred | 0.00% |
| Other | 0.33% |
Top 10 Holdings
| Name | % Weight | Price | % Change |
|---|---|---|---|
|
USD/EUR Forward Contract
|
20.32% | -- | -- |
|
USD/GBP Forward Contract
|
8.96% | -- | -- |
|
USD/KRW NDF
|
4.70% | -- | -- |
|
USD/CNH Forward Contract
|
3.57% | -- | -- |
|
USD/CAD Forward Contract
|
3.57% | -- | -- |
|
United Kingdom of Great Britain and Northern Ireland (Government) 4% 22-OCT-2031
|
2.92% | -- | -- |
|
Italy, Republic of (Government) 1.45% 01-MAR-2036
|
2.25% | -- | -- |
| Canada CAN 2.25 02/01/2028 FIX CAD Government | 2.24% | 99.18 | 0.02% |
|
Korea, Republic of (Government) 2.5% 10-SEP-2030
|
2.18% | -- | -- |
|
United Kingdom of Great Britain and Northern Ireland (Government) 4.5% 07-MAR-2035
|
1.97% | -- | -- |
Fees & Availability
| Fees | |
| Actual 12B-1 Fee | -- |
| Actual Management Fee | 0.54% |
| Administration Fee | 150.5K% |
| Maximum Front Load | -- |
| Maximum Deferred Load | -- |
| Maximum Redemption Fee | -- |
| General Availability | |
| Available for Insurance Product | No |
| Available for RRSP | No |
| Purchase Details | |
| Open to New Investors |
|
| Minimum Initial Investment | 0.00 None |
| Minimum Subsequent Investment | 0.00 None |
Basic Info
| Investment Strategy | |
| The Fund seeks total return with an emphasis on current income, but also considering capital appreciation. The Fund invests at least 80% of its assets in debt instruments of U.S. and foreign issuers, including emerging markets issuers. The Fund generally focuses on debt instruments of U.S. and foreign governments. |
| General | |
| Security Type | Mutual Fund |
| Equity Style | -- |
| Broad Asset Class | Taxable Bond |
| Broad Category | Fixed Income |
| Global Peer Group | Bond Global USD |
| Peer Group | Global Income Funds |
| Global Macro | Bond Global |
| US Macro | World Income Funds |
| YCharts Categorization | -- |
| YCharts Benchmark | -- |
| Prospectus Objective | Global Income Funds |
| Fund Owner Firm Name | MFS |
| Broad Asset Class Benchmark Index | |
| ^BBUSATR | 100.0% |
Fundamentals
| General | |
| Distribution Yield | -- |
| Dividend Yield TTM (6-1-26) | 4.83% |
| 30-Day SEC Yield (4-30-26) | 4.43% |
| 7-Day SEC Yield | -- |
| Number of Holdings | 806 |
| Bond | |
| Yield to Maturity (4-30-26) | 5.02% |
| Effective Duration | 6.55 |
| Average Coupon | 4.63% |
| Calculated Average Quality | 3.536 |
| Effective Maturity | 10.89 |
| Nominal Maturity | 11.06 |
| Number of Bond Holdings | 726 |
As of April 30, 2026
Fund Details
| Key Dates | |
| Inception Date | 10/1/2012 |
| Last Annual Report Date | 11/30/2025 |
| Last Prospectus Date | 3/28/2025 |
| Share Classes | |
| MGBAX | A |
| MGBBX | B |
| MGBDX | C |
| MGBJX | Inst |
| MGBKX | Retirement |
| MGBLX | Retirement |
| MGBMX | Retirement |
| MGBNX | Retirement |
| Attributes | |
| Index Fund | -- |
| Inverse Fund | No |
| Leveraged Fund | -- |
| Fund of Funds | No |
| Currency Hedged Fund | -- |
| Socially Responsible Fund | No |
Top Portfolio Holders
| Name | % Weight |
|---|---|
| Portfolio A | 5.00% |
| Portfolio B | 3.50% |
| Portfolio C | 2.25% |
Excel Add-In Codes
| Name: =YCI("M:MGBOX", "name") |
| Broad Asset Class: =YCI("M:MGBOX", "broad_asset_class") |
| Broad Category: =YCI("M:MGBOX", "broad_category_group") |
| Prospectus Objective: =YCI("M:MGBOX", "prospectus_objective") |
| To find the codes for any of our securities and financial metrics, see our Complete Excel Reference. |