

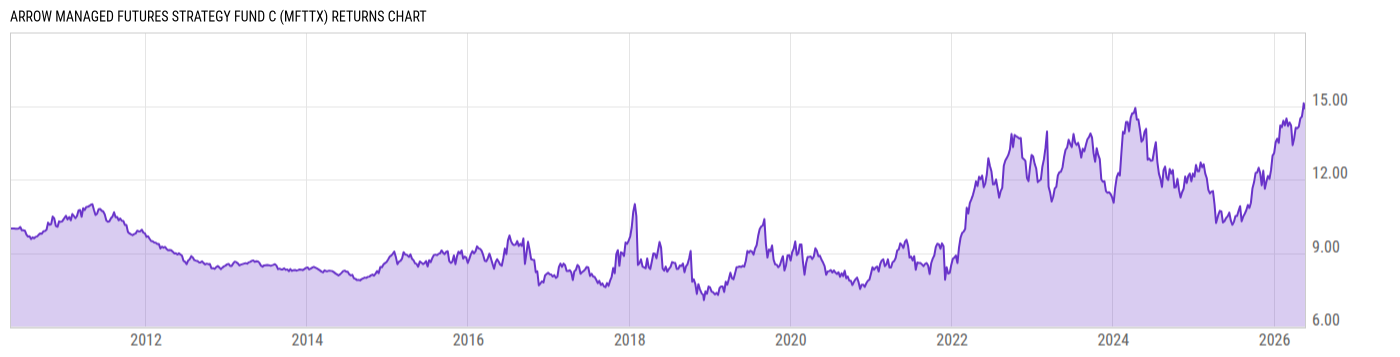
Arrow Managed Futures Strategy Fund C (MFTTX)
6.05
-0.06
(-0.98%)
USD |
Jun 09 2026
Returns Chart
Key Stats
| Net Expense Ratio | Total Assets Under Management | Weighted Average Dividend Yield | Turnover Ratio (Generic) |
|---|---|---|---|
| 2.46% | 229.40M | -- | 0.10% |
| 1 Year Fund Level Flows | 1 Year Total Returns (Daily) | Annualized Total Returns Since Inception (Daily) | Max Drawdown (Since Inception) |
| -42.29M | 35.65% |
Basic Info
| Investment Strategy | |
| The Fund seeks to provide investment results that match the performance of a benchmark for measuring trends in the commodity and financial futures markets. The benchmark is constructed to capture both up and down price trends in physical commodities, global currencies and US interest rates. |
| General | |
| Security Type | Mutual Fund |
| Equity Style | -- |
| Broad Asset Class | Alternative |
| Broad Category | Alternative Strategies |
| Global Peer Group | Alternative Managed Futures |
| Peer Group | Alternative Managed Futures Funds |
| Global Macro | Liquid Alternatives |
| US Macro | Alternative Equity Funds |
| YCharts Categorization | -- |
| YCharts Benchmark | -- |
| Prospectus Objective | Alternative Managed Futures Funds |
| Fund Owner Firm Name | Arrow Funds |
| Broad Asset Class Benchmark Index | |
| ^MSACWINTR | 100.0% |
Net Fund Flows Versus Peer Group
1 Month
% Rank:
99
-41.47M
Peer Group Low
306.75M
Peer Group High
1 Year
% Rank:
74
-42.29M
-826.18M
Peer Group Low
2.211B
Peer Group High
3 Months
% Rank:
91
-210.36M
Peer Group Low
769.56M
Peer Group High
3 Years
% Rank:
39
-1.928B
Peer Group Low
2.725B
Peer Group High
6 Months
% Rank:
87
-240.81M
Peer Group Low
1.642B
Peer Group High
5 Years
% Rank:
39
-579.46M
Peer Group Low
3.481B
Peer Group High
YTD
% Rank:
93
-86.53M
Peer Group Low
1.607B
Peer Group High
10 Years
% Rank:
47
-8.257B
Peer Group Low
3.524B
Peer Group High
Date Unavailable
Risk
Performance Versus Peer Group
Annual Total Returns Versus Peers
As of June 10, 2026.
Asset Allocation
As of January 31, 2026.
| Type | % Net |
|---|---|
| Cash | 10.98% |
| Stock | 0.00% |
| Bond | 26.25% |
| Convertible | 0.00% |
| Preferred | 0.00% |
| Other | 62.77% |
Top 5 Holdings
| Name | % Weight | Price | % Change |
|---|---|---|---|
|
Galaxy Plus Fund LLC Dunn Financials Feeder Fund
|
41.39% | -- | -- |
|
Arrow Managed Futures Trend Fund
|
21.52% | -- | -- |
| First American Government Obligations Fd X | 19.73% | 1.00 | 0.00% |
| Arrow Reserve Capital Management ETF | 17.45% | 100.18 | 0.02% |
|
Other Assets less Liabilities
|
-0.10% | -- | -- |
Fees & Availability
| Fees | |
| Actual 12B-1 Fee | 1.00% |
| Actual Management Fee | 0.85% |
| Administration Fee | 2.14K% |
| Maximum Front Load | -- |
| Maximum Deferred Load | -- |
| Maximum Redemption Fee | 1.00% |
| General Availability | |
| Available for Insurance Product | No |
| Available for RRSP | No |
| Purchase Details | |
| Open to New Investors |
|
| Minimum Initial Investment | 5000.00 None |
| Minimum Subsequent Investment | 250.00 None |
Basic Info
| Investment Strategy | |
| The Fund seeks to provide investment results that match the performance of a benchmark for measuring trends in the commodity and financial futures markets. The benchmark is constructed to capture both up and down price trends in physical commodities, global currencies and US interest rates. |
| General | |
| Security Type | Mutual Fund |
| Equity Style | -- |
| Broad Asset Class | Alternative |
| Broad Category | Alternative Strategies |
| Global Peer Group | Alternative Managed Futures |
| Peer Group | Alternative Managed Futures Funds |
| Global Macro | Liquid Alternatives |
| US Macro | Alternative Equity Funds |
| YCharts Categorization | -- |
| YCharts Benchmark | -- |
| Prospectus Objective | Alternative Managed Futures Funds |
| Fund Owner Firm Name | Arrow Funds |
| Broad Asset Class Benchmark Index | |
| ^MSACWINTR | 100.0% |
Fundamentals
| General | |
| Distribution Yield | -- |
| Dividend Yield TTM (6-8-26) | 26.13% |
| 30-Day SEC Yield | -- |
| 7-Day SEC Yield | -- |
| Number of Holdings | 5 |
Top Portfolio Holders
| Name | % Weight |
|---|---|
| Portfolio A | 5.00% |
| Portfolio B | 3.50% |
| Portfolio C | 2.25% |
Excel Add-In Codes
| Name: =YCI("M:MFTTX", "name") |
| Broad Asset Class: =YCI("M:MFTTX", "broad_asset_class") |
| Broad Category: =YCI("M:MFTTX", "broad_category_group") |
| Prospectus Objective: =YCI("M:MFTTX", "prospectus_objective") |
| To find the codes for any of our securities and financial metrics, see our Complete Excel Reference. |