

Meridian Contrarian Fund Investor (MFCIX)
44.68
+0.16
(+0.36%)
USD |
Jun 09 2026
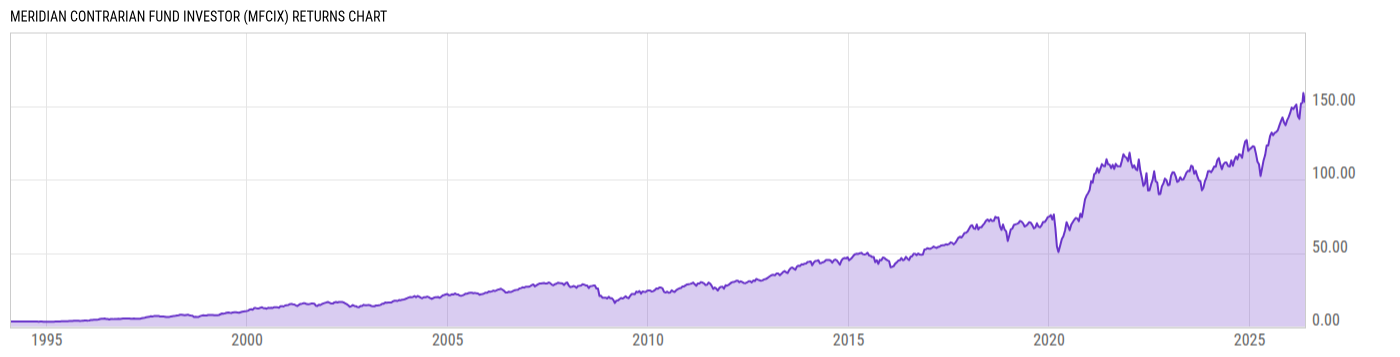
Returns Chart
Key Stats
| Net Expense Ratio | Total Assets Under Management | Weighted Average Dividend Yield | Turnover Ratio (Generic) |
|---|---|---|---|
| 1.21% | 599.80M | 0.59% | 45.00% |
| 1 Year Fund Level Flows | 1 Year Total Returns (Daily) | Annualized Total Returns Since Inception (Daily) | Max Drawdown (Since Inception) |
| -42.26M | 27.26% |
Basic Info
| Investment Strategy | |
| The Fund seeks long-term growth of capital. Under normal circumstances, the Fund invests in a diversified portfolio of publicly traded common stocks of U.S. companies that are likely to have recently underperformed their peers, or the market due to what the Investment Adviser deems to be temporary operational issues. |
| General | |
| Security Type | Mutual Fund |
| Equity Style | Small Cap Core |
| Broad Asset Class | US Equity |
| Broad Category | Equity |
| Global Peer Group | Equity US Sm&Mid Cap |
| Peer Group | Small-Cap Core Funds |
| Global Macro | Equity North America |
| US Macro | Small-Cap Funds |
| YCharts Categorization | -- |
| YCharts Benchmark | -- |
| Prospectus Objective | Small-Cap Funds |
| Fund Owner Firm Name | Meridian Funds |
| Broad Asset Class Benchmark Index | |
| ^SPXTR | 100.0% |
Net Fund Flows Versus Peer Group
1 Month
% Rank:
61
-1.408B
Peer Group Low
769.95M
Peer Group High
1 Year
% Rank:
53
-42.26M
-7.752B
Peer Group Low
2.189B
Peer Group High
3 Months
% Rank:
58
-1.690B
Peer Group Low
933.62M
Peer Group High
3 Years
% Rank:
60
-4.427B
Peer Group Low
6.105B
Peer Group High
6 Months
% Rank:
58
-3.555B
Peer Group Low
1.954B
Peer Group High
5 Years
% Rank:
64
-8.891B
Peer Group Low
7.897B
Peer Group High
YTD
% Rank:
--
-5.360B
Peer Group Low
1.730B
Peer Group High
10 Years
% Rank:
71
-10.79B
Peer Group Low
29.63B
Peer Group High
Date Unavailable
Risk
Performance Versus Peer Group
Annual Total Returns Versus Peers
As of June 10, 2026.
Asset Allocation
As of March 31, 2026.
| Type | % Net |
|---|---|
| Cash | 5.10% |
| Stock | 90.59% |
| Bond | 3.54% |
| Convertible | 0.00% |
| Preferred | 1.02% |
| Other | -0.26% |
Top 10 Holdings
| Name | % Weight | Price | % Change |
|---|---|---|---|
| Goldman Sachs FS Government Fund Institutional | 8.64% | 1.00 | 0.00% |
| Texas Capital Bancshares, Inc. | 2.91% | 100.95 | 0.35% |
| Envista Holdings Corp. | 2.86% | 24.59 | 4.91% |
| First Citizens BancShares, Inc. (North Carolina) | 2.53% | 2100.68 | 1.27% |
| Regal Rexnord Corp. | 2.47% | 213.30 | 1.44% |
| California Resources Corp. | 2.46% | 58.45 | -2.58% |
| CACI International, Inc. | 2.32% | 525.04 | 1.14% |
| Sun Communities, Inc. | 2.08% | 124.73 | 2.08% |
| Constellium SE | 2.08% | 34.00 | -0.56% |
| Evergy, Inc. | 2.06% | 82.27 | 0.71% |
Fees & Availability
| Fees | |
| Actual 12B-1 Fee | -- |
| Actual Management Fee | 1.00% |
| Administration Fee | -- |
| Maximum Front Load | -- |
| Maximum Deferred Load | -- |
| Maximum Redemption Fee | 2.00% |
| General Availability | |
| Available for Insurance Product | No |
| Available for RRSP | No |
| Purchase Details | |
| Open to New Investors |
|
| Minimum Initial Investment | 2500.00 None |
| Minimum Subsequent Investment | 50.00 None |
Basic Info
| Investment Strategy | |
| The Fund seeks long-term growth of capital. Under normal circumstances, the Fund invests in a diversified portfolio of publicly traded common stocks of U.S. companies that are likely to have recently underperformed their peers, or the market due to what the Investment Adviser deems to be temporary operational issues. |
| General | |
| Security Type | Mutual Fund |
| Equity Style | Small Cap Core |
| Broad Asset Class | US Equity |
| Broad Category | Equity |
| Global Peer Group | Equity US Sm&Mid Cap |
| Peer Group | Small-Cap Core Funds |
| Global Macro | Equity North America |
| US Macro | Small-Cap Funds |
| YCharts Categorization | -- |
| YCharts Benchmark | -- |
| Prospectus Objective | Small-Cap Funds |
| Fund Owner Firm Name | Meridian Funds |
| Broad Asset Class Benchmark Index | |
| ^SPXTR | 100.0% |
Fundamentals
| General | |
| Distribution Yield | -- |
| Dividend Yield TTM (6-8-26) | 0.25% |
| 30-Day SEC Yield | -- |
| 7-Day SEC Yield | -- |
| Number of Holdings | 75 |
| Stock | |
| Weighted Average PE Ratio | 34.70 |
| Weighted Average Price to Sales Ratio | 4.578 |
| Weighted Average Price to Book Ratio | 3.864 |
| Weighted Median ROE | 3.60% |
| Weighted Median ROA | 0.29% |
| ROI (TTM) | 1.78% |
| Return on Investment (TTM) | 1.78% |
| Earning Yield | 0.0426 |
| LT Debt / Shareholders Equity | 0.8212 |
| Number of Equity Holdings | 73 |
As of March 31, 2026
Growth Metrics
| EPS Growth (1Y) | 19.20% |
| EPS Growth (3Y) | 0.14% |
| EPS Growth (5Y) | 6.05% |
| Sales Growth (1Y) | 12.12% |
| Sales Growth (3Y) | 7.66% |
| Sales Growth (5Y) | 10.20% |
| Sales per Share Growth (1Y) | 8.87% |
| Sales per Share Growth (3Y) | 5.89% |
| Operating Cash Flow - Growth Rate (3Y) | 25.06% |
As of March 31, 2026
Fund Details
Top Portfolio Holders
| Name | % Weight |
|---|---|
| Portfolio A | 5.00% |
| Portfolio B | 3.50% |
| Portfolio C | 2.25% |
Excel Add-In Codes
| Name: =YCI("M:MFCIX", "name") |
| Broad Asset Class: =YCI("M:MFCIX", "broad_asset_class") |
| Broad Category: =YCI("M:MFCIX", "broad_category_group") |
| Prospectus Objective: =YCI("M:MFCIX", "prospectus_objective") |
| To find the codes for any of our securities and financial metrics, see our Complete Excel Reference. |