

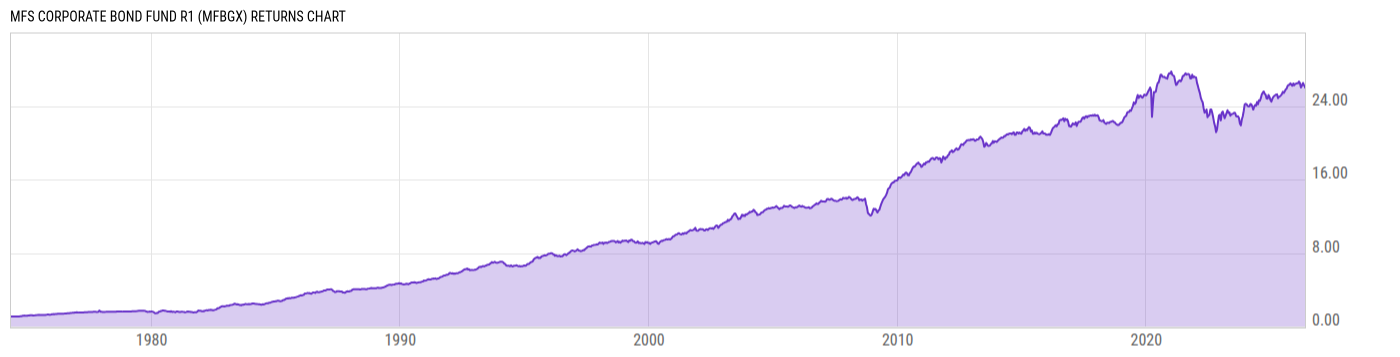
MFS Corporate Bond Fund R1 (MFBGX)
12.31
+0.03
(+0.24%)
USD |
Jun 09 2026
Returns Chart
Key Stats
| Net Expense Ratio | Total Assets Under Management | Weighted Average Dividend Yield | Turnover Ratio (Generic) |
|---|---|---|---|
| 1.51% | 4.353B | -- | 38.00% |
| 1 Year Fund Level Flows | 1 Year Total Returns (Daily) | Annualized Total Returns Since Inception (Daily) | Max Drawdown (Since Inception) |
| -385.41M | 4.65% |
Basic Info
| Investment Strategy | |
| The Fund seeks total return with an emphasis on current income, also considering capital appreciation. The Fund normally invests at least 80% of the funds net assets in corporate debt instruments. The Fund may also invest the funds assets in U.S. Government securities and also in foreign securities. |
| General | |
| Security Type | Mutual Fund |
| Equity Style | -- |
| Broad Asset Class | Taxable Bond |
| Broad Category | Fixed Income |
| Global Peer Group | Bond USD Corporates |
| Peer Group | Corporate Debt Funds BBB-Rated |
| Global Macro | Bond Corporates |
| US Macro | General Domestic Taxable Fixed Income Funds |
| YCharts Categorization | -- |
| YCharts Benchmark | -- |
| Prospectus Objective | Corporate Debt Funds BBB-Rated |
| Fund Owner Firm Name | MFS |
| Broad Asset Class Benchmark Index | |
| ^BBUSATR | 100.0% |
Net Fund Flows Versus Peer Group
1 Month
% Rank:
95
-1.441B
Peer Group Low
748.99M
Peer Group High
1 Year
% Rank:
94
-385.41M
-3.244B
Peer Group Low
12.80B
Peer Group High
3 Months
% Rank:
97
-1.908B
Peer Group Low
1.681B
Peer Group High
3 Years
% Rank:
91
-9.856B
Peer Group Low
25.39B
Peer Group High
6 Months
% Rank:
97
-3.368B
Peer Group Low
8.887B
Peer Group High
5 Years
% Rank:
96
-10.18B
Peer Group Low
26.92B
Peer Group High
YTD
% Rank:
97
-471.58M
Peer Group Low
7.655B
Peer Group High
10 Years
% Rank:
37
-8.640B
Peer Group Low
62.93B
Peer Group High
Date Unavailable
Risk
Performance Versus Peer Group
Annual Total Returns Versus Peers
As of June 10, 2026.
Asset Allocation
As of April 30, 2026.
| Type | % Net |
|---|---|
| Cash | 1.35% |
| Stock | 0.00% |
| Bond | 98.43% |
| Convertible | 0.00% |
| Preferred | 0.00% |
| Other | 0.22% |
Top 10 Holdings
| Name | % Weight | Price | % Change |
|---|---|---|---|
|
USD Cash
|
1.35% | -- | -- |
| UBS Group AG UBSGRO 3.126 08/13/2030 FLT USD Corporate 144A '29 | 0.78% | 94.76 | 0.08% |
| JPMorgan Chase & Co. JPM 2.545 11/08/2032 FLT USD Corporate '31 | 0.77% | 88.64 | 0.17% |
| THE BOEING COMPANY BA 5.805 05/01/2050 FIX USD Corporate | 0.76% | 98.36 | 0.38% |
| THE CHARLES SCHWAB CORPORATION SCH 4.914 11/14/2036 FLT USD Corporate '35 | 0.63% | 96.66 | 0.27% |
| British Overseas Territory of Bermuda BERMUD 5.0 07/15/2032 FIX USD Sovereign 144A | 0.59% | 100.31 | 0.23% |
| Morgan Stanley MWD 5.073 01/30/2037 FLT USD Corporate '36 | 0.58% | 97.38 | 0.23% |
| Sumitomo Mitsui Financial Group, Inc. SUMIBK 1.71 01/12/2031 FIX USD Corporate | 0.58% | 87.20 | 0.17% |
| UBS Group AG UBSGRO 5.58 05/09/2036 FLT USD Corporate 144A '35 | 0.55% | 101.22 | 0.25% |
| CaixaBank, S.A. CAXBNK 6.84 09/13/2034 FLT USD Corporate 144A '33 | 0.54% | 108.77 | 0.20% |
Fees & Availability
| Fees | |
| Actual 12B-1 Fee | 1.00% |
| Actual Management Fee | 0.37% |
| Administration Fee | 554.0% |
| Maximum Front Load | -- |
| Maximum Deferred Load | -- |
| Maximum Redemption Fee | -- |
| General Availability | |
| Available for Insurance Product | No |
| Available for RRSP | No |
| Purchase Details | |
| Open to New Investors | No |
| Minimum Initial Investment | 0.00 None |
| Minimum Subsequent Investment | 0.00 None |
Basic Info
| Investment Strategy | |
| The Fund seeks total return with an emphasis on current income, also considering capital appreciation. The Fund normally invests at least 80% of the funds net assets in corporate debt instruments. The Fund may also invest the funds assets in U.S. Government securities and also in foreign securities. |
| General | |
| Security Type | Mutual Fund |
| Equity Style | -- |
| Broad Asset Class | Taxable Bond |
| Broad Category | Fixed Income |
| Global Peer Group | Bond USD Corporates |
| Peer Group | Corporate Debt Funds BBB-Rated |
| Global Macro | Bond Corporates |
| US Macro | General Domestic Taxable Fixed Income Funds |
| YCharts Categorization | -- |
| YCharts Benchmark | -- |
| Prospectus Objective | Corporate Debt Funds BBB-Rated |
| Fund Owner Firm Name | MFS |
| Broad Asset Class Benchmark Index | |
| ^BBUSATR | 100.0% |
Fundamentals
| General | |
| Distribution Yield | -- |
| Dividend Yield TTM (6-9-26) | 3.78% |
| 30-Day SEC Yield (4-30-26) | 3.82% |
| 7-Day SEC Yield | -- |
| Number of Holdings | 432 |
| Bond | |
| Yield to Maturity (4-30-26) | 5.45% |
| Effective Duration | 6.60 |
| Average Coupon | 5.13% |
| Calculated Average Quality | 3.651 |
| Effective Maturity | 10.39 |
| Nominal Maturity | 10.85 |
| Number of Bond Holdings | 414 |
As of April 30, 2026
Fund Details
| Key Dates | |
| Inception Date | 4/1/2005 |
| Last Annual Report Date | 4/30/2025 |
| Last Prospectus Date | 8/28/2025 |
| Share Classes | |
| MBDIX | Inst |
| MBRRX | Retirement |
| MFBBX | B |
| MFBCX | C |
| MFBFX | A |
| MFBHX | Retirement |
| MFBJX | Retirement |
| MFBKX | Retirement |
| Attributes | |
| Index Fund | -- |
| Inverse Fund | No |
| Leveraged Fund | -- |
| Fund of Funds | No |
| Currency Hedged Fund | -- |
| Socially Responsible Fund | No |
Top Portfolio Holders
| Name | % Weight |
|---|---|
| Portfolio A | 5.00% |
| Portfolio B | 3.50% |
| Portfolio C | 2.25% |
Excel Add-In Codes
| Name: =YCI("M:MFBGX", "name") |
| Broad Asset Class: =YCI("M:MFBGX", "broad_asset_class") |
| Broad Category: =YCI("M:MFBGX", "broad_category_group") |
| Prospectus Objective: =YCI("M:MFBGX", "prospectus_objective") |
| To find the codes for any of our securities and financial metrics, see our Complete Excel Reference. |