

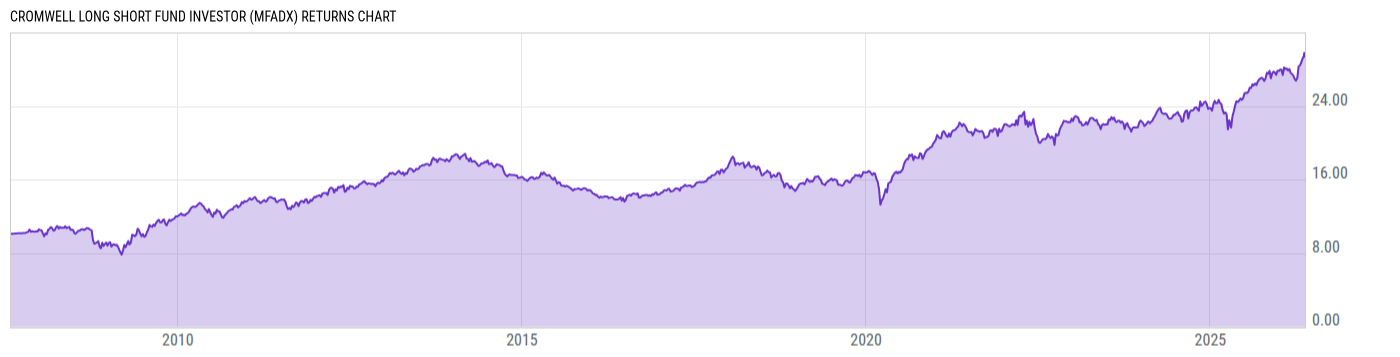
Cromwell Long Short Fund Investor (MFADX)
28.03
-0.02
(-0.07%)
USD |
Jun 09 2026
Returns Chart
Key Stats
| Net Expense Ratio | Total Assets Under Management | Weighted Average Dividend Yield | Turnover Ratio (Generic) |
|---|---|---|---|
| 1.96% | 91.21M | -- | 18.00% |
| 1 Year Fund Level Flows | 1 Year Total Returns (Daily) | Annualized Total Returns Since Inception (Daily) | Max Drawdown (Since Inception) |
| -12.11M | 18.25% |
Basic Info
| Investment Strategy | |
| The Fund seeks capital appreciation while trying to achieve volatility lower than that of the broad equity market. The Fund intends to maintain a net long exposure of 25% to 80% of its net assets. The Funds long positions may range from 60% to 95% of its net assets and its short positions may range from 10% to 50%. |
| General | |
| Security Type | Mutual Fund |
| Equity Style | -- |
| Broad Asset Class | Alternative |
| Broad Category | Alternative Strategies |
| Global Peer Group | Alternative Long/Short Equity US |
| Peer Group | Alternative Long/Short Equity Funds |
| Global Macro | Alternative Equity |
| US Macro | Alternative Equity Funds |
| YCharts Categorization | -- |
| YCharts Benchmark | -- |
| Prospectus Objective | Alternative Long/Short Equity Funds |
| Fund Owner Firm Name | Cromwell Funds |
| Broad Asset Class Benchmark Index | |
| ^MSACWINTR | 100.0% |
Net Fund Flows Versus Peer Group
1 Month
% Rank:
64
-598.12M
Peer Group Low
823.99M
Peer Group High
1 Year
% Rank:
76
-12.11M
-248.79M
Peer Group Low
5.532B
Peer Group High
3 Months
% Rank:
67
-722.58M
Peer Group Low
2.242B
Peer Group High
3 Years
% Rank:
84
-583.32M
Peer Group Low
9.347B
Peer Group High
6 Months
% Rank:
70
-455.92M
Peer Group Low
3.568B
Peer Group High
5 Years
% Rank:
84
-954.50M
Peer Group Low
9.538B
Peer Group High
YTD
% Rank:
73
-441.75M
Peer Group Low
3.346B
Peer Group High
10 Years
% Rank:
94
-6.742B
Peer Group Low
8.592B
Peer Group High
Date Unavailable
Risk
Performance Versus Peer Group
Annual Total Returns Versus Peers
As of June 10, 2026.
Asset Allocation
As of March 31, 2026.
| Type | % Net |
|---|---|
| Cash | 7.83% |
| Stock | 81.48% |
| Bond | 10.93% |
| Convertible | 0.00% |
| Preferred | 0.00% |
| Other | -0.23% |
Top 10 Holdings
| Name | % Weight | Price | % Change |
|---|---|---|---|
| BNY Dreyfus Treasury Obligations Cash Mgmt Inst | 18.59% | 1.00 | 0.00% |
| NVIDIA Corp. | 7.63% | 205.86 | -1.12% |
| Alphabet, Inc. | 5.31% | 365.85 | 0.44% |
| Microsoft Corp. | 5.07% | 402.30 | -0.28% |
| Apple, Inc. | 4.29% | 289.91 | -0.22% |
| Amazon.com, Inc. | 3.67% | 241.88 | -0.95% |
| JPMorgan Chase & Co. | 3.11% | 313.61 | 0.29% |
| Johnson & Johnson | 2.39% | 239.66 | 1.12% |
| Broadcom Inc. | 2.39% | 374.67 | -4.46% |
| Visa, Inc. | 2.10% | 322.52 | -0.78% |
Fees & Availability
| Fees | |
| Actual 12B-1 Fee | 0.25% |
| Actual Management Fee | 1.10% |
| Administration Fee | 23.53K% |
| Maximum Front Load | 0.00% |
| Maximum Deferred Load | -- |
| Maximum Redemption Fee | -- |
| General Availability | |
| Available for Insurance Product | No |
| Available for RRSP | No |
| Purchase Details | |
| Open to New Investors |
|
| Minimum Initial Investment | 2000.00 None |
| Minimum Subsequent Investment | 100.00 None |
Basic Info
| Investment Strategy | |
| The Fund seeks capital appreciation while trying to achieve volatility lower than that of the broad equity market. The Fund intends to maintain a net long exposure of 25% to 80% of its net assets. The Funds long positions may range from 60% to 95% of its net assets and its short positions may range from 10% to 50%. |
| General | |
| Security Type | Mutual Fund |
| Equity Style | -- |
| Broad Asset Class | Alternative |
| Broad Category | Alternative Strategies |
| Global Peer Group | Alternative Long/Short Equity US |
| Peer Group | Alternative Long/Short Equity Funds |
| Global Macro | Alternative Equity |
| US Macro | Alternative Equity Funds |
| YCharts Categorization | -- |
| YCharts Benchmark | -- |
| Prospectus Objective | Alternative Long/Short Equity Funds |
| Fund Owner Firm Name | Cromwell Funds |
| Broad Asset Class Benchmark Index | |
| ^MSACWINTR | 100.0% |
Fundamentals
| General | |
| Distribution Yield | -- |
| Dividend Yield TTM (6-8-26) | 0.02% |
| 30-Day SEC Yield | -- |
| 7-Day SEC Yield | -- |
| Number of Holdings | 166 |
| Stock | |
| Weighted Average PE Ratio | 30.27 |
| Weighted Average Price to Sales Ratio | 7.842 |
| Weighted Average Price to Book Ratio | 11.55 |
| Weighted Median ROE | 142.8% |
| Weighted Median ROA | 18.75% |
| ROI (TTM) | 26.46% |
| Return on Investment (TTM) | 26.46% |
| Earning Yield | 0.0398 |
| LT Debt / Shareholders Equity | 0.8634 |
| Number of Equity Holdings | 163 |
| Bond | |
| Yield to Maturity (3-31-26) | -- |
| Effective Duration | -- |
| Average Coupon | -- |
| Calculated Average Quality | 0.00 |
| Effective Maturity | -- |
| Nominal Maturity | -- |
| Number of Bond Holdings | 0 |
As of March 31, 2026
Growth Metrics
| EPS Growth (1Y) | 27.34% |
| EPS Growth (3Y) | 20.32% |
| EPS Growth (5Y) | 29.76% |
| Sales Growth (1Y) | 15.41% |
| Sales Growth (3Y) | 15.81% |
| Sales Growth (5Y) | 17.71% |
| Sales per Share Growth (1Y) | 16.62% |
| Sales per Share Growth (3Y) | 17.25% |
| Operating Cash Flow - Growth Rate (3Y) | 27.71% |
As of March 31, 2026
Fund Details
| Key Dates | |
| Inception Date | 10/5/2012 |
| Last Annual Report Date | 12/31/2025 |
| Last Prospectus Date | 4/30/2026 |
| Share Classes | |
| MFLDX | Inst |
| Attributes | |
| Index Fund | -- |
| Inverse Fund | No |
| Leveraged Fund | -- |
| Fund of Funds | No |
| Currency Hedged Fund | -- |
| Socially Responsible Fund | No |
Top Portfolio Holders
| Name | % Weight |
|---|---|
| Portfolio A | 5.00% |
| Portfolio B | 3.50% |
| Portfolio C | 2.25% |
Excel Add-In Codes
| Name: =YCI("M:MFADX", "name") |
| Broad Asset Class: =YCI("M:MFADX", "broad_asset_class") |
| Broad Category: =YCI("M:MFADX", "broad_category_group") |
| Prospectus Objective: =YCI("M:MFADX", "prospectus_objective") |
| To find the codes for any of our securities and financial metrics, see our Complete Excel Reference. |