

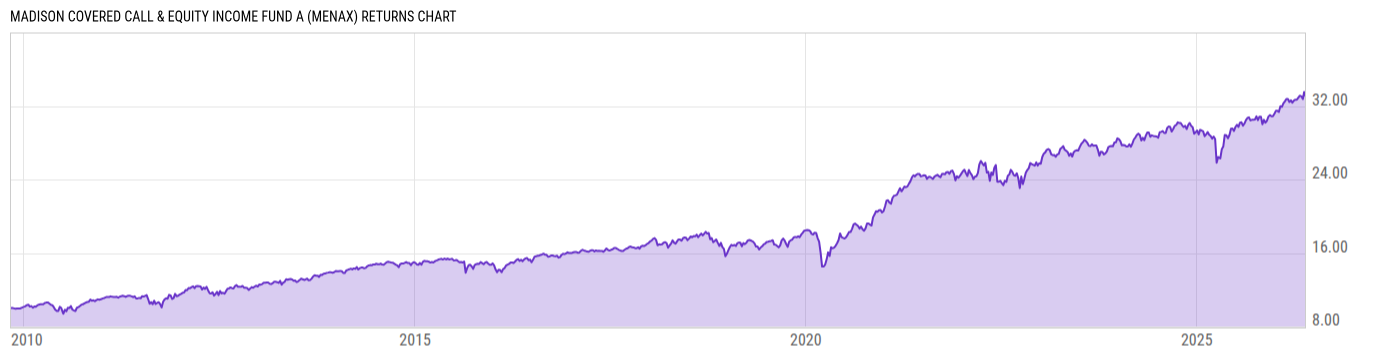
Madison Covered Call & Equity Income Fund A (MENAX)
8.94
0.00 (0.00%)
USD |
Jun 09 2026
Returns Chart
Key Stats
| Net Expense Ratio | Total Assets Under Management | Weighted Average Dividend Yield | Turnover Ratio (Generic) |
|---|---|---|---|
| 1.28% | 136.45M | 2.32% | 78.00% |
| 1 Year Fund Level Flows | 1 Year Total Returns (Daily) | Annualized Total Returns Since Inception (Daily) | Max Drawdown (Since Inception) |
| -90.35M | 11.14% |
Basic Info
| Investment Strategy | |
| The Fund seeks to provide consistent total return, and secondarily, to provide a high level of income and gains from option premiums. The Fund will invest at least 80% of its assets in common stocks, with at least 65% of this amount invested in common stocks of large-cap issuers that meet the Funds selection criteria. |
| General | |
| Security Type | Mutual Fund |
| Equity Style | Multi Cap Value |
| Broad Asset Class | Miscellaneous |
| Broad Category | Alternative Strategies |
| Global Peer Group | Alternative Relative Value |
| Peer Group | Option Income Strategies Funds |
| Global Macro | Liquid Alternatives |
| US Macro | -- |
| YCharts Categorization | -- |
| YCharts Benchmark | -- |
| Prospectus Objective | -- |
| Fund Owner Firm Name | Madison Funds |
| Broad Asset Class Benchmark Index | |
| ^SPXTR | 100.0% |
Net Fund Flows Versus Peer Group
1 Month
% Rank:
68
-160.82M
Peer Group Low
599.92M
Peer Group High
1 Year
% Rank:
90
-90.35M
-1.686B
Peer Group Low
8.657B
Peer Group High
3 Months
% Rank:
39
-560.96M
Peer Group Low
2.043B
Peer Group High
3 Years
% Rank:
95
-2.299B
Peer Group Low
24.97B
Peer Group High
6 Months
% Rank:
90
-1.040B
Peer Group Low
4.312B
Peer Group High
5 Years
% Rank:
98
-24.19M
Peer Group Low
32.89B
Peer Group High
YTD
% Rank:
90
-926.77M
Peer Group Low
3.902B
Peer Group High
10 Years
% Rank:
99
-90.41M
Peer Group Low
34.57B
Peer Group High
Date Unavailable
Risk
Performance Versus Peer Group
Annual Total Returns Versus Peers
As of June 10, 2026.
Asset Allocation
As of April 30, 2026.
| Type | % Net |
|---|---|
| Cash | 6.88% |
| Stock | 90.42% |
| Bond | 7.03% |
| Convertible | 0.00% |
| Preferred | 0.00% |
| Other | -4.33% |
Top 10 Holdings
| Name | % Weight | Price | % Change |
|---|---|---|---|
| State Street US Government Money Market Fund Prem | 13.91% | 1.00 | 0.00% |
| Transocean Ltd. | 8.20% | 5.87 | -4.86% |
| Matador Resources Co. | 6.15% | 53.73 | -2.86% |
| PepsiCo, Inc. | 5.82% | 142.78 | 1.49% |
| APA Corp. | 5.62% | 36.61 | -2.79% |
| Microchip Technology, Inc. | 5.13% | 91.47 | 0.11% |
| Archer-Daniels-Midland Co. | 5.06% | 80.12 | -0.12% |
| CVS Health Corp. | 4.60% | 97.06 | -0.02% |
| Constellation Brands, Inc. | 3.56% | 140.09 | -0.54% |
| Las Vegas Sands Corp. | 3.25% | 51.65 | 1.69% |
Fees & Availability
| Fees | |
| Actual 12B-1 Fee | 0.25% |
| Actual Management Fee | 0.85% |
| Administration Fee | 40.43K% |
| Maximum Front Load | 5.75% |
| Maximum Deferred Load | -- |
| Maximum Redemption Fee | -- |
| General Availability | |
| Available for Insurance Product | No |
| Available for RRSP | No |
| Purchase Details | |
| Open to New Investors |
|
| Minimum Initial Investment | 1000.00 None |
| Minimum Subsequent Investment | 50.00 None |
Basic Info
| Investment Strategy | |
| The Fund seeks to provide consistent total return, and secondarily, to provide a high level of income and gains from option premiums. The Fund will invest at least 80% of its assets in common stocks, with at least 65% of this amount invested in common stocks of large-cap issuers that meet the Funds selection criteria. |
| General | |
| Security Type | Mutual Fund |
| Equity Style | Multi Cap Value |
| Broad Asset Class | Miscellaneous |
| Broad Category | Alternative Strategies |
| Global Peer Group | Alternative Relative Value |
| Peer Group | Option Income Strategies Funds |
| Global Macro | Liquid Alternatives |
| US Macro | -- |
| YCharts Categorization | -- |
| YCharts Benchmark | -- |
| Prospectus Objective | -- |
| Fund Owner Firm Name | Madison Funds |
| Broad Asset Class Benchmark Index | |
| ^SPXTR | 100.0% |
Fundamentals
| General | |
| Distribution Yield | -- |
| Dividend Yield TTM (6-8-26) | 8.71% |
| 30-Day SEC Yield (5-31-26) | 0.63% |
| 7-Day SEC Yield | -- |
| Number of Holdings | 54 |
| Stock | |
| Weighted Average PE Ratio | 25.54 |
| Weighted Average Price to Sales Ratio | 4.229 |
| Weighted Average Price to Book Ratio | 5.989 |
| Weighted Median ROE | 28.18% |
| Weighted Median ROA | 5.42% |
| ROI (TTM) | 8.06% |
| Return on Investment (TTM) | 8.06% |
| Earning Yield | 0.0530 |
| LT Debt / Shareholders Equity | 1.476 |
| Number of Equity Holdings | 28 |
| Bond | |
| Yield to Maturity (4-30-26) | -- |
| Effective Duration | -- |
| Average Coupon | -- |
| Calculated Average Quality | 0.00 |
| Effective Maturity | -- |
| Nominal Maturity | -- |
| Number of Bond Holdings | 0 |
As of April 30, 2026
Growth Metrics
| EPS Growth (1Y) | 0.94% |
| EPS Growth (3Y) | 2.47% |
| EPS Growth (5Y) | 14.67% |
| Sales Growth (1Y) | 2.06% |
| Sales Growth (3Y) | 4.69% |
| Sales Growth (5Y) | 9.88% |
| Sales per Share Growth (1Y) | 2.28% |
| Sales per Share Growth (3Y) | 4.74% |
| Operating Cash Flow - Growth Rate (3Y) | 3.15% |
As of April 30, 2026
Top Portfolio Holders
| Name | % Weight |
|---|---|
| Portfolio A | 5.00% |
| Portfolio B | 3.50% |
| Portfolio C | 2.25% |
Excel Add-In Codes
| Name: =YCI("M:MENAX", "name") |
| Broad Asset Class: =YCI("M:MENAX", "broad_asset_class") |
| Broad Category: =YCI("M:MENAX", "broad_category_group") |
| Prospectus Objective: =YCI("M:MENAX", "prospectus_objective") |
| To find the codes for any of our securities and financial metrics, see our Complete Excel Reference. |