

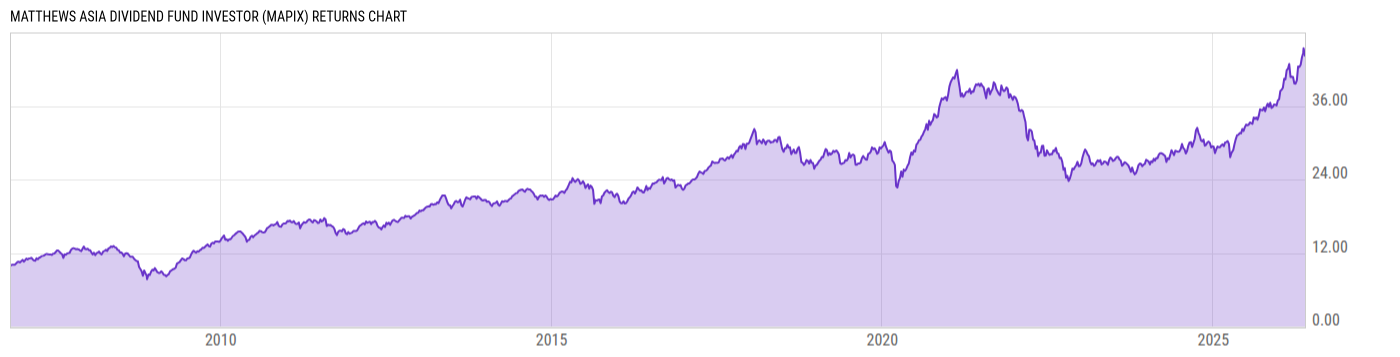
Matthews Asia Dividend Fund Investor (MAPIX)
20.35
-0.05
(-0.25%)
USD |
Jun 09 2026
Returns Chart
Key Stats
| Net Expense Ratio | Total Assets Under Management | Weighted Average Dividend Yield | Turnover Ratio (Generic) |
|---|---|---|---|
| 1.21% | 718.55M | 2.67% | 57.00% |
| 1 Year Fund Level Flows | 1 Year Total Returns (Daily) | Annualized Total Returns Since Inception (Daily) | Max Drawdown (Since Inception) |
| -132.75M | 35.43% |
Basic Info
| Investment Strategy | |
| The Fund seeks total return with an emphasis on providing current income. Under normal market conditions, the Fund will typically invest at least 80% of its total net assets in income-paying publicly traded common stocks and other equity-related instruments of companies located in the Asia Pacific region. |
| General | |
| Security Type | Mutual Fund |
| Equity Style | Large Cap Core |
| Broad Asset Class | International Equity |
| Broad Category | Equity |
| Global Peer Group | Equity Asia Pacific |
| Peer Group | International Equity Income Funds |
| Global Macro | Equity Asia Pacific |
| US Macro | Developed International Markets Funds |
| YCharts Categorization | -- |
| YCharts Benchmark | -- |
| Prospectus Objective | Pacific Region Funds |
| Fund Owner Firm Name | Matthews Asia |
| Broad Asset Class Benchmark Index | |
| ^MSACXUSNTR | 100.0% |
Net Fund Flows Versus Peer Group
1 Month
% Rank:
92
-122.66M
Peer Group Low
201.51M
Peer Group High
1 Year
% Rank:
97
-132.75M
-705.67M
Peer Group Low
5.930B
Peer Group High
3 Months
% Rank:
84
-218.22M
Peer Group Low
549.16M
Peer Group High
3 Years
% Rank:
99
-1.863B
Peer Group Low
8.513B
Peer Group High
6 Months
% Rank:
85
-493.35M
Peer Group Low
3.622B
Peer Group High
5 Years
% Rank:
100
-3.770B
Peer Group Low
12.15B
Peer Group High
YTD
% Rank:
84
-507.71M
Peer Group Low
2.979B
Peer Group High
10 Years
% Rank:
100
-5.323B
Peer Group Low
14.75B
Peer Group High
Date Unavailable
Risk
Performance Versus Peer Group
Annual Total Returns Versus Peers
As of June 10, 2026.
Asset Allocation
As of April 30, 2026.
| Type | % Net |
|---|---|
| Cash | 0.00% |
| Stock | 97.23% |
| Bond | 0.00% |
| Convertible | 0.00% |
| Preferred | 0.00% |
| Other | 2.77% |
Top 10 Holdings
| Name | % Weight | Price | % Change |
|---|---|---|---|
| Taiwan Semiconductor Manufacturing Co., Ltd. | 12.15% | 17.24 | 0.00% |
| Samsung Electronics Co., Ltd. | 7.60% | 140.00 | 0.00% |
|
Hana Financial Group Inc ORD
|
3.03% | -- | -- |
|
Other Assets less Liabilities
|
2.77% | -- | -- |
| Marubeni Corp. | 2.61% | 30.25 | 0.50% |
| Alibaba Group Holding Ltd. | 2.52% | 15.22 | -5.96% |
|
Delta Electronics Inc ORD
|
2.30% | -- | -- |
| Mitsubishi UFJ Financial Group, Inc. | 2.29% | 19.78 | -2.56% |
| Tencent Holdings Ltd. | 2.27% | 57.46 | 0.98% |
| ORIX Corp. | 2.21% | 36.75 | -3.90% |
Fees & Availability
| Fees | |
| Actual 12B-1 Fee | -- |
| Actual Management Fee | 0.71% |
| Administration Fee | 585.4K% |
| Maximum Front Load | -- |
| Maximum Deferred Load | -- |
| Maximum Redemption Fee | 0.00% |
| General Availability | |
| Available for Insurance Product | No |
| Available for RRSP | No |
| Purchase Details | |
| Open to New Investors |
|
| Minimum Initial Investment | 2500.00 None |
| Minimum Subsequent Investment | 100.00 None |
Basic Info
| Investment Strategy | |
| The Fund seeks total return with an emphasis on providing current income. Under normal market conditions, the Fund will typically invest at least 80% of its total net assets in income-paying publicly traded common stocks and other equity-related instruments of companies located in the Asia Pacific region. |
| General | |
| Security Type | Mutual Fund |
| Equity Style | Large Cap Core |
| Broad Asset Class | International Equity |
| Broad Category | Equity |
| Global Peer Group | Equity Asia Pacific |
| Peer Group | International Equity Income Funds |
| Global Macro | Equity Asia Pacific |
| US Macro | Developed International Markets Funds |
| YCharts Categorization | -- |
| YCharts Benchmark | -- |
| Prospectus Objective | Pacific Region Funds |
| Fund Owner Firm Name | Matthews Asia |
| Broad Asset Class Benchmark Index | |
| ^MSACXUSNTR | 100.0% |
Fundamentals
| General | |
| Distribution Yield | -- |
| Dividend Yield TTM (6-8-26) | 2.50% |
| 30-Day SEC Yield | -- |
| 7-Day SEC Yield | -- |
| Number of Holdings | 73 |
| Stock | |
| Weighted Average PE Ratio | 22.23 |
| Weighted Average Price to Sales Ratio | 5.355 |
| Weighted Average Price to Book Ratio | 3.885 |
| Weighted Median ROE | 15.99% |
| Weighted Median ROA | 7.86% |
| ROI (TTM) | 13.44% |
| Return on Investment (TTM) | 13.44% |
| Earning Yield | 0.0610 |
| LT Debt / Shareholders Equity | 0.5092 |
| Number of Equity Holdings | 66 |
As of April 30, 2026
Growth Metrics
| EPS Growth (1Y) | 22.97% |
| EPS Growth (3Y) | 13.19% |
| EPS Growth (5Y) | 14.86% |
| Sales Growth (1Y) | 10.91% |
| Sales Growth (3Y) | 7.69% |
| Sales Growth (5Y) | 8.82% |
| Sales per Share Growth (1Y) | 11.84% |
| Sales per Share Growth (3Y) | 8.22% |
| Operating Cash Flow - Growth Rate (3Y) | 8.89% |
As of April 30, 2026
Fund Details
| Key Dates | |
| Inception Date | 10/31/2006 |
| Last Annual Report Date | 12/31/2025 |
| Last Prospectus Date | 4/30/2025 |
| Share Classes | |
| MIPIX | Inst |
| Attributes | |
| Index Fund | -- |
| Inverse Fund | No |
| Leveraged Fund | -- |
| Fund of Funds | No |
| Currency Hedged Fund | -- |
| Socially Responsible Fund | No |
Top Portfolio Holders
| Name | % Weight |
|---|---|
| Portfolio A | 5.00% |
| Portfolio B | 3.50% |
| Portfolio C | 2.25% |
Excel Add-In Codes
| Name: =YCI("M:MAPIX", "name") |
| Broad Asset Class: =YCI("M:MAPIX", "broad_asset_class") |
| Broad Category: =YCI("M:MAPIX", "broad_category_group") |
| Prospectus Objective: =YCI("M:MAPIX", "prospectus_objective") |
| To find the codes for any of our securities and financial metrics, see our Complete Excel Reference. |