

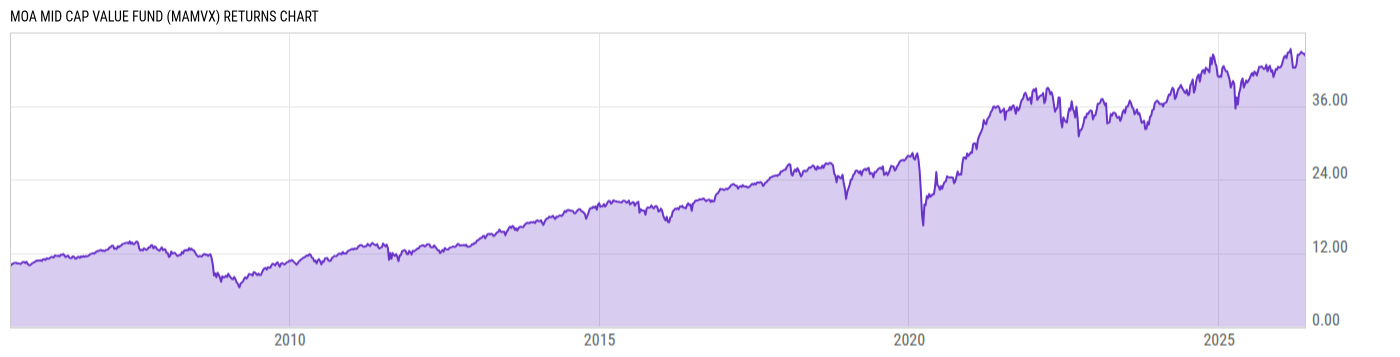
MoA Mid Cap Value Fund (MAMVX)
17.14
+0.09
(+0.53%)
USD |
May 22 2026
Returns Chart
Key Stats
| Net Expense Ratio | Total Assets Under Management | Weighted Average Dividend Yield | Turnover Ratio (Generic) |
|---|---|---|---|
| 0.70% | 208.10M | 1.38% | 36.00% |
| 1 Year Fund Level Flows | 1 Year Total Returns (Daily) | Annualized Total Returns Since Inception (Daily) | Max Drawdown (Since Inception) |
| -28.78M | 13.76% |
Basic Info
| Investment Strategy | |
| The Fund seeks capital appreciation and, to a lesser extent, current income. The Fund invests primarily in value stocks issued by companies with mid-sized market capitalizations that the Adviser believes to be undervalued in the marketplace in relation to factors such as the company's assets, earnings or growth potential. |
| General | |
| Security Type | Mutual Fund |
| Equity Style | Mid Cap Core |
| Broad Asset Class | US Equity |
| Broad Category | Equity |
| Global Peer Group | Equity US Sm&Mid Cap |
| Peer Group | Mid-Cap Core Funds |
| Global Macro | Equity North America |
| US Macro | Mid-Cap Funds |
| YCharts Categorization | -- |
| YCharts Benchmark | -- |
| Prospectus Objective | Mid-Cap Funds |
| Fund Owner Firm Name | Mutual of America |
| Broad Asset Class Benchmark Index | |
| ^SPXTR | 100.0% |
Net Fund Flows Versus Peer Group
1 Month
% Rank:
43
-510.90M
Peer Group Low
842.42M
Peer Group High
1 Year
% Rank:
37
-28.78M
-4.212B
Peer Group Low
4.000B
Peer Group High
3 Months
% Rank:
38
-2.099B
Peer Group Low
2.441B
Peer Group High
3 Years
% Rank:
19
-7.161B
Peer Group Low
8.440B
Peer Group High
6 Months
% Rank:
31
-2.839B
Peer Group Low
3.080B
Peer Group High
5 Years
% Rank:
20
-10.35B
Peer Group Low
13.49B
Peer Group High
YTD
% Rank:
40
-2.189B
Peer Group Low
2.085B
Peer Group High
10 Years
% Rank:
26
-16.89B
Peer Group Low
26.12B
Peer Group High
Date Unavailable
Risk
Performance Versus Peer Group
Annual Total Returns Versus Peers
As of May 23, 2026.
Asset Allocation
As of April 30, 2026.
| Type | % Net |
|---|---|
| Cash | 0.72% |
| Stock | 97.88% |
| Bond | 0.77% |
| Convertible | 0.00% |
| Preferred | 0.00% |
| Other | 0.62% |
Top 10 Holdings
| Name | % Weight | Price | % Change |
|---|---|---|---|
| Entergy Corp. | 2.67% | 112.40 | 0.12% |
| AMETEK, Inc. | 2.62% | 224.52 | 0.60% |
| Evergy, Inc. | 2.51% | 83.94 | 0.35% |
| Crown Holdings, Inc. | 2.48% | 96.71 | 0.26% |
| Teledyne Technologies, Inc. | 2.42% | 620.45 | 2.20% |
| Crane Co. | 2.37% | 179.75 | 2.48% |
| Devon Energy Corp. | 2.24% | 47.22 | 0.23% |
| Applied Industrial Technologies, Inc. | 2.19% | 307.10 | 0.47% |
| The Williams Cos., Inc. | 2.12% | 78.47 | 1.23% |
| MKS, Inc. | 2.10% | 320.62 | 2.38% |
Fees & Availability
| Fees | |
| Actual 12B-1 Fee | -- |
| Actual Management Fee | 0.55% |
| Administration Fee | 42.46K% |
| Maximum Front Load | -- |
| Maximum Deferred Load | -- |
| Maximum Redemption Fee | -- |
| General Availability | |
| Available for Insurance Product | No |
| Available for RRSP | No |
| Purchase Details | |
| Open to New Investors |
|
| Minimum Initial Investment | 3000.00 None |
| Minimum Subsequent Investment | 100.00 None |
Basic Info
| Investment Strategy | |
| The Fund seeks capital appreciation and, to a lesser extent, current income. The Fund invests primarily in value stocks issued by companies with mid-sized market capitalizations that the Adviser believes to be undervalued in the marketplace in relation to factors such as the company's assets, earnings or growth potential. |
| General | |
| Security Type | Mutual Fund |
| Equity Style | Mid Cap Core |
| Broad Asset Class | US Equity |
| Broad Category | Equity |
| Global Peer Group | Equity US Sm&Mid Cap |
| Peer Group | Mid-Cap Core Funds |
| Global Macro | Equity North America |
| US Macro | Mid-Cap Funds |
| YCharts Categorization | -- |
| YCharts Benchmark | -- |
| Prospectus Objective | Mid-Cap Funds |
| Fund Owner Firm Name | Mutual of America |
| Broad Asset Class Benchmark Index | |
| ^SPXTR | 100.0% |
Fundamentals
| General | |
| Distribution Yield | -- |
| Dividend Yield TTM (5-21-26) | 1.12% |
| 30-Day SEC Yield | -- |
| 7-Day SEC Yield | -- |
| Number of Holdings | 10 |
| Stock | |
| Weighted Average PE Ratio | 28.64 |
| Weighted Average Price to Sales Ratio | 4.345 |
| Weighted Average Price to Book Ratio | 5.259 |
| Weighted Median ROE | 17.83% |
| Weighted Median ROA | 6.55% |
| ROI (TTM) | 11.98% |
| Return on Investment (TTM) | 11.98% |
| Earning Yield | 0.0467 |
| LT Debt / Shareholders Equity | 1.006 |
| Number of Equity Holdings | 10 |
As of April 30, 2026
Growth Metrics
| EPS Growth (1Y) | 15.15% |
| EPS Growth (3Y) | 6.15% |
| EPS Growth (5Y) | 21.35% |
| Sales Growth (1Y) | 8.90% |
| Sales Growth (3Y) | 5.57% |
| Sales Growth (5Y) | 10.96% |
| Sales per Share Growth (1Y) | 9.46% |
| Sales per Share Growth (3Y) | 5.14% |
| Operating Cash Flow - Growth Rate (3Y) | 19.29% |
As of April 30, 2026
Fund Details
| Key Dates | |
| Inception Date | 7/1/2005 |
| Last Annual Report Date | 12/31/2025 |
| Last Prospectus Date | 5/1/2026 |
| Attributes | |
| Index Fund | -- |
| Inverse Fund | No |
| Leveraged Fund | -- |
| Fund of Funds | No |
| Currency Hedged Fund | -- |
| Socially Responsible Fund | No |
Top Portfolio Holders
| Name | % Weight |
|---|---|
| Portfolio A | 5.00% |
| Portfolio B | 3.50% |
| Portfolio C | 2.25% |
Excel Add-In Codes
| Name: =YCI("M:MAMVX", "name") |
| Broad Asset Class: =YCI("M:MAMVX", "broad_asset_class") |
| Broad Category: =YCI("M:MAMVX", "broad_category_group") |
| Prospectus Objective: =YCI("M:MAMVX", "prospectus_objective") |
| To find the codes for any of our securities and financial metrics, see our Complete Excel Reference. |