

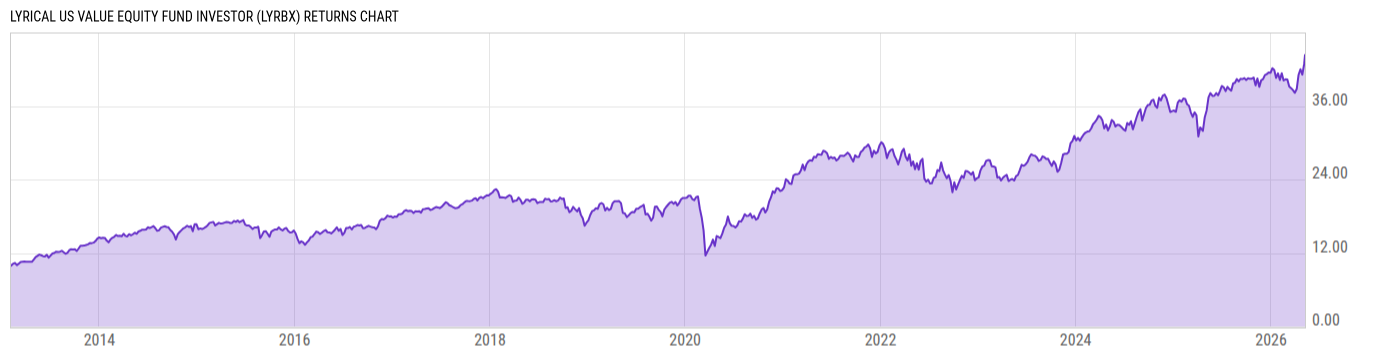
Lyrical US Value Equity Fund Investor (LYRBX)
31.95
+0.43
(+1.36%)
USD |
May 29 2026
Returns Chart
Key Stats
| Net Expense Ratio | Total Assets Under Management | Weighted Average Dividend Yield | Turnover Ratio (Generic) |
|---|---|---|---|
| 1.24% | 1.262B | 1.04% | 32.00% |
| 1 Year Fund Level Flows | 1 Year Total Returns (Daily) | Annualized Total Returns Since Inception (Daily) | Max Drawdown (Since Inception) |
| -19.72M | 22.72% |
Basic Info
| Investment Strategy | |
| The Fund seeks to achieve long-term capital growth. The Fund seeks to achieve its investment objective by investing at least 80% of its net assets in a diversified portfolio of common stock of mid-capitalization and large-capitalization companies with low valuations relative to their long-term normalized earnings. |
| General | |
| Security Type | Mutual Fund |
| Equity Style | Mid Cap Core |
| Broad Asset Class | US Equity |
| Broad Category | Equity |
| Global Peer Group | Equity US Sm&Mid Cap |
| Peer Group | Mid-Cap Core Funds |
| Global Macro | Equity North America |
| US Macro | Mid-Cap Funds |
| YCharts Categorization | -- |
| YCharts Benchmark | -- |
| Prospectus Objective | Mid-Cap Funds |
| Fund Owner Firm Name | Lyrical Asset Management |
| Broad Asset Class Benchmark Index | |
| ^SPXTR | 100.0% |
Net Fund Flows Versus Peer Group
1 Month
% Rank:
15
-510.90M
Peer Group Low
891.20M
Peer Group High
1 Year
% Rank:
30
-19.72M
-4.347B
Peer Group Low
4.882B
Peer Group High
3 Months
% Rank:
61
-2.099B
Peer Group Low
2.770B
Peer Group High
3 Years
% Rank:
12
-7.475B
Peer Group Low
9.203B
Peer Group High
6 Months
% Rank:
34
-2.839B
Peer Group Low
3.341B
Peer Group High
5 Years
% Rank:
13
-10.52B
Peer Group Low
13.49B
Peer Group High
YTD
% Rank:
39
-2.189B
Peer Group Low
2.756B
Peer Group High
10 Years
% Rank:
52
-17.16B
Peer Group Low
26.12B
Peer Group High
Date Unavailable
Risk
Performance Versus Peer Group
Annual Total Returns Versus Peers
As of May 30, 2026.
Asset Allocation
As of March 31, 2026.
| Type | % Net |
|---|---|
| Cash | -0.03% |
| Stock | 100.0% |
| Bond | 0.00% |
| Convertible | 0.00% |
| Preferred | 0.00% |
| Other | 0.00% |
Top 10 Holdings
| Name | % Weight | Price | % Change |
|---|---|---|---|
| Johnson Controls International Plc | 5.93% | 134.06 | -1.54% |
| NRG Energy, Inc. | 5.89% | 134.08 | -2.49% |
| Expedia Group, Inc. | 5.87% | 225.79 | -0.77% |
| eBay, Inc. | 5.45% | 109.27 | -2.55% |
| AerCap Holdings NV | 4.70% | 139.39 | 0.30% |
| Flex Ltd. | 4.66% | 150.78 | 4.09% |
| HCA Healthcare, Inc. | 4.47% | 378.54 | -1.52% |
| Corpay, Inc. | 4.16% | 361.80 | 2.68% |
| NetApp, Inc. | 4.07% | 174.29 | 22.39% |
| Ameriprise Financial, Inc. | 3.94% | 445.71 | 1.33% |
Fees & Availability
| Fees | |
| Actual 12B-1 Fee | 0.25% |
| Actual Management Fee | 0.47% |
| Administration Fee | 6.87K% |
| Maximum Front Load | -- |
| Maximum Deferred Load | -- |
| Maximum Redemption Fee | -- |
| General Availability | |
| Available for Insurance Product | No |
| Available for RRSP | No |
| Purchase Details | |
| Open to New Investors |
|
| Minimum Initial Investment | 2500.00 None |
| Minimum Subsequent Investment | 0.00 None |
Basic Info
| Investment Strategy | |
| The Fund seeks to achieve long-term capital growth. The Fund seeks to achieve its investment objective by investing at least 80% of its net assets in a diversified portfolio of common stock of mid-capitalization and large-capitalization companies with low valuations relative to their long-term normalized earnings. |
| General | |
| Security Type | Mutual Fund |
| Equity Style | Mid Cap Core |
| Broad Asset Class | US Equity |
| Broad Category | Equity |
| Global Peer Group | Equity US Sm&Mid Cap |
| Peer Group | Mid-Cap Core Funds |
| Global Macro | Equity North America |
| US Macro | Mid-Cap Funds |
| YCharts Categorization | -- |
| YCharts Benchmark | -- |
| Prospectus Objective | Mid-Cap Funds |
| Fund Owner Firm Name | Lyrical Asset Management |
| Broad Asset Class Benchmark Index | |
| ^SPXTR | 100.0% |
Fundamentals
| General | |
| Distribution Yield | -- |
| Dividend Yield TTM (5-28-26) | 0.16% |
| 30-Day SEC Yield | -- |
| 7-Day SEC Yield | -- |
| Number of Holdings | 33 |
| Stock | |
| Weighted Average PE Ratio | 21.67 |
| Weighted Average Price to Sales Ratio | 2.388 |
| Weighted Average Price to Book Ratio | 6.506 |
| Weighted Median ROE | 634.5% |
| Weighted Median ROA | 5.82% |
| ROI (TTM) | 12.84% |
| Return on Investment (TTM) | 12.84% |
| Earning Yield | 0.0588 |
| LT Debt / Shareholders Equity | 1.159 |
| Number of Equity Holdings | 32 |
As of March 31, 2026
Growth Metrics
| EPS Growth (1Y) | 13.88% |
| EPS Growth (3Y) | 18.34% |
| EPS Growth (5Y) | 21.36% |
| Sales Growth (1Y) | 6.21% |
| Sales Growth (3Y) | 4.92% |
| Sales Growth (5Y) | 10.89% |
| Sales per Share Growth (1Y) | 11.35% |
| Sales per Share Growth (3Y) | 9.51% |
| Operating Cash Flow - Growth Rate (3Y) | 22.44% |
As of March 31, 2026
Fund Details
Top Portfolio Holders
| Name | % Weight |
|---|---|
| Portfolio A | 5.00% |
| Portfolio B | 3.50% |
| Portfolio C | 2.25% |
Excel Add-In Codes
| Name: =YCI("M:LYRBX", "name") |
| Broad Asset Class: =YCI("M:LYRBX", "broad_asset_class") |
| Broad Category: =YCI("M:LYRBX", "broad_category_group") |
| Prospectus Objective: =YCI("M:LYRBX", "prospectus_objective") |
| To find the codes for any of our securities and financial metrics, see our Complete Excel Reference. |