

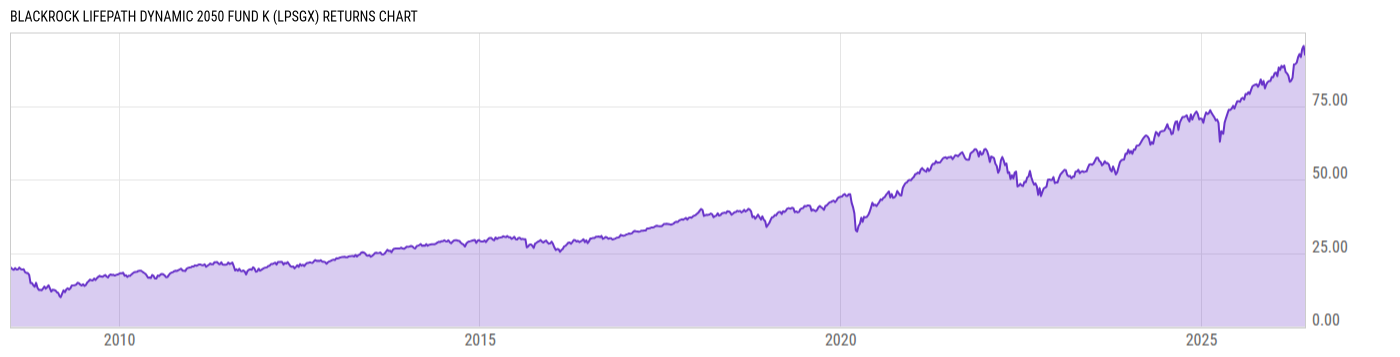
BlackRock LifePath Dynamic 2050 Fund K (LPSGX)
28.13
-0.06
(-0.21%)
USD |
Jun 09 2026
Returns Chart
Key Stats
| Net Expense Ratio | Total Assets Under Management | Weighted Average Dividend Yield | Turnover Ratio (Generic) |
|---|---|---|---|
| 0.34% | 447.66M | -- | 23.00% |
| 1 Year Fund Level Flows | 1 Year Total Returns (Daily) | Annualized Total Returns Since Inception (Daily) | Max Drawdown (Since Inception) |
| 18.21M | 23.75% |
Basic Info
| Investment Strategy | |
| The Fund seeks to provide for retirement outcomes based on quantitatively measured risk. In pursuit of this objective, the Fund will be broadly diversified across global asset classes, with asset allocations becoming more conservative over time. The Fund intends to invest in affiliated open-end funds and affiliated ETFs. |
| General | |
| Security Type | Mutual Fund |
| Equity Style | -- |
| Broad Asset Class | Allocation |
| Broad Category | Allocation |
| Global Peer Group | Target Maturity MA USD 2050 |
| Peer Group | Mixed-Asset Target 2050 Funds |
| Global Macro | Target Maturity |
| US Macro | Mixed-Assets Target Date Funds |
| YCharts Categorization | -- |
| YCharts Benchmark | -- |
| Prospectus Objective | Growth Funds |
| Fund Owner Firm Name | BlackRock |
| Broad Asset Class Benchmark Index | |
| ^SPXTR | 100.0% |
Net Fund Flows Versus Peer Group
1 Month
% Rank:
21
-371.63M
Peer Group Low
357.98M
Peer Group High
1 Year
% Rank:
29
18.21M
-1.962B
Peer Group Low
3.057B
Peer Group High
3 Months
% Rank:
22
-1.084B
Peer Group Low
1.183B
Peer Group High
3 Years
% Rank:
31
-2.544B
Peer Group Low
10.11B
Peer Group High
6 Months
% Rank:
60
-1.245B
Peer Group Low
1.980B
Peer Group High
5 Years
% Rank:
31
-3.959B
Peer Group Low
11.92B
Peer Group High
YTD
% Rank:
61
-909.04M
Peer Group Low
1.901B
Peer Group High
10 Years
% Rank:
50
-7.437B
Peer Group Low
17.37B
Peer Group High
Date Unavailable
Risk
Performance Versus Peer Group
Annual Total Returns Versus Peers
As of June 10, 2026.
Asset Allocation
As of December 31, 2025.
| Type | % Net |
|---|---|
| Cash | -2.91% |
| Stock | 23.90% |
| Bond | 7.04% |
| Convertible | 0.00% |
| Preferred | 0.19% |
| Other | 71.78% |
Top 10 Holdings
| Name | % Weight | Price | % Change |
|---|---|---|---|
|
DIVERSIFIED EQUITY MASTER FUND
|
45.77% | -- | -- |
|
INTERNATIONAL TILTS MASTER PORTFOLIO
|
14.68% | -- | -- |
| iShares Core MSCI Emerging Markets ETF | 10.66% | 80.04 | 0.09% |
|
M EMINI JUN26
|
6.00% | -- | -- |
| iShares Core MSCI International Developed Mkt ETF | 5.73% | 88.75 | 0.07% |
| BlackRock Cash Funds: Treasury SL Agency | 5.33% | 1.00 | 0.00% |
| BlackRock Tactical Opportunities Fund K | 5.02% | 17.35 | -0.23% |
| iShares Broad USD Investment Grade Corporate Bond | 3.52% | 50.97 | 0.26% |
|
DIVERSIFIED FIXED INCOME FUND
|
3.23% | -- | -- |
|
1RTY JUN26
|
3.12% | -- | -- |
Fees & Availability
| Fees | |
| Actual 12B-1 Fee | -- |
| Actual Management Fee | 0.08% |
| Administration Fee | 90.51K% |
| Maximum Front Load | -- |
| Maximum Deferred Load | -- |
| Maximum Redemption Fee | -- |
| General Availability | |
| Available for Insurance Product | No |
| Available for RRSP | No |
| Purchase Details | |
| Open to New Investors |
|
| Minimum Initial Investment | 5.00M None |
| Minimum Subsequent Investment | 0.00 None |
Basic Info
| Investment Strategy | |
| The Fund seeks to provide for retirement outcomes based on quantitatively measured risk. In pursuit of this objective, the Fund will be broadly diversified across global asset classes, with asset allocations becoming more conservative over time. The Fund intends to invest in affiliated open-end funds and affiliated ETFs. |
| General | |
| Security Type | Mutual Fund |
| Equity Style | -- |
| Broad Asset Class | Allocation |
| Broad Category | Allocation |
| Global Peer Group | Target Maturity MA USD 2050 |
| Peer Group | Mixed-Asset Target 2050 Funds |
| Global Macro | Target Maturity |
| US Macro | Mixed-Assets Target Date Funds |
| YCharts Categorization | -- |
| YCharts Benchmark | -- |
| Prospectus Objective | Growth Funds |
| Fund Owner Firm Name | BlackRock |
| Broad Asset Class Benchmark Index | |
| ^SPXTR | 100.0% |
Fundamentals
| General | |
| Distribution Yield | -- |
| Dividend Yield TTM (6-8-26) | 1.59% |
| 30-Day SEC Yield | -- |
| 7-Day SEC Yield | -- |
| Number of Holdings | 10 |
| Stock | |
| Weighted Average PE Ratio | 26.27 |
| Weighted Average Price to Sales Ratio | 5.650 |
| Weighted Average Price to Book Ratio | 5.329 |
| Weighted Median ROE | 32.79% |
| Weighted Median ROA | 8.29% |
| ROI (TTM) | 13.98% |
| Return on Investment (TTM) | 13.98% |
| Earning Yield | 0.0543 |
| LT Debt / Shareholders Equity | 0.7693 |
| Number of Equity Holdings | 0 |
| Bond | |
| Yield to Maturity (12-31-25) | 4.71% |
| Effective Duration | -0.02 |
| Average Coupon | 4.64% |
| Calculated Average Quality | 3.341 |
| Effective Maturity | 7.935 |
| Nominal Maturity | 8.151 |
| Number of Bond Holdings | 0 |
As of December 31, 2025
Growth Metrics
| EPS Growth (1Y) | 25.04% |
| EPS Growth (3Y) | 12.00% |
| EPS Growth (5Y) | 15.41% |
| Sales Growth (1Y) | 12.32% |
| Sales Growth (3Y) | 11.71% |
| Sales Growth (5Y) | 11.86% |
| Sales per Share Growth (1Y) | 14.04% |
| Sales per Share Growth (3Y) | 11.23% |
| Operating Cash Flow - Growth Rate (3Y) | 16.07% |
As of December 31, 2025
Fund Details
Top Portfolio Holders
| Name | % Weight |
|---|---|
| Portfolio A | 5.00% |
| Portfolio B | 3.50% |
| Portfolio C | 2.25% |
Excel Add-In Codes
| Name: =YCI("M:LPSGX", "name") |
| Broad Asset Class: =YCI("M:LPSGX", "broad_asset_class") |
| Broad Category: =YCI("M:LPSGX", "broad_category_group") |
| Prospectus Objective: =YCI("M:LPSGX", "prospectus_objective") |
| To find the codes for any of our securities and financial metrics, see our Complete Excel Reference. |