

ALPS Global Opportunity Fund R (LPERX)
3.37
+0.05
(+1.51%)
USD |
May 29 2026
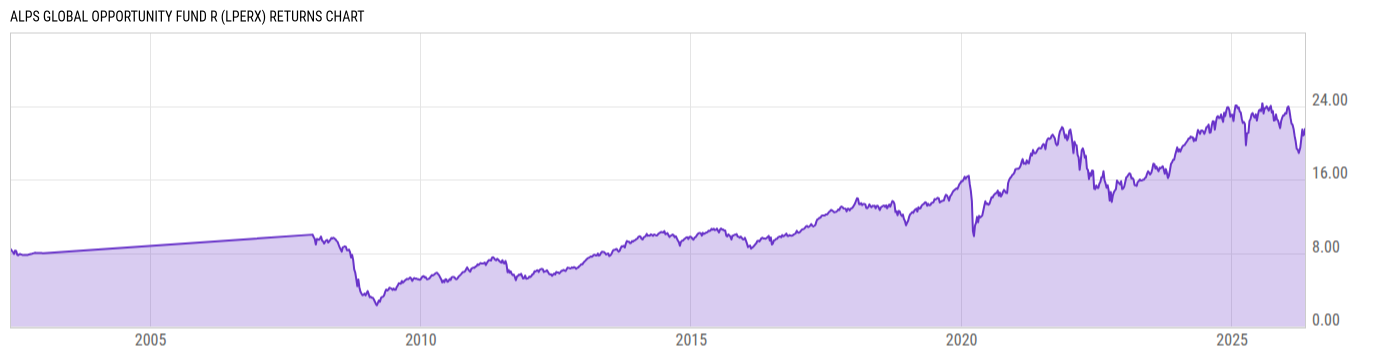
Returns Chart
Key Stats
| Net Expense Ratio | Total Assets Under Management | Weighted Average Dividend Yield | Turnover Ratio (Generic) |
|---|---|---|---|
| 1.74% | 44.72M | 1.74% | 31.00% |
| 1 Year Fund Level Flows | 1 Year Total Returns (Daily) | Annualized Total Returns Since Inception (Daily) | Max Drawdown (Since Inception) |
| -13.90M | -5.01% |
Basic Info
| Investment Strategy | |
| The Fund seeks to maximize total return. The Fund will invest in (i) equity securities of U.S. and non-U.S. companies, including those in emerging markets, listed on a national securities exchange, or foreign equivalent, and (ii) derivatives, including options, futures, forwards, swap agreements and participation notes. |
| General | |
| Security Type | Mutual Fund |
| Equity Style | Multi Cap Growth |
| Broad Asset Class | Sector Equity |
| Broad Category | Equity |
| Global Peer Group | Equity Sector Financials |
| Peer Group | Global Financial Services Funds |
| Global Macro | Equity Industry Sector |
| US Macro | World Sector Equity Funds |
| YCharts Categorization | -- |
| YCharts Benchmark | -- |
| Prospectus Objective | Global Financial Services Funds |
| Fund Owner Firm Name | SS&C ALPS Advisors |
| Broad Asset Class Benchmark Index | |
| ^MSWNTR | 100.0% |
Net Fund Flows Versus Peer Group
1 Month
% Rank:
82
-44.35M
Peer Group Low
12.05M
Peer Group High
1 Year
% Rank:
75
-13.90M
-1.172B
Peer Group Low
256.41M
Peer Group High
3 Months
% Rank:
69
-766.98M
Peer Group Low
115.01M
Peer Group High
3 Years
% Rank:
82
-155.21M
Peer Group Low
256.41M
Peer Group High
6 Months
% Rank:
69
-1.057B
Peer Group Low
134.98M
Peer Group High
5 Years
% Rank:
82
-2.310B
Peer Group Low
256.41M
Peer Group High
YTD
% Rank:
63
-1.092B
Peer Group Low
135.98M
Peer Group High
10 Years
% Rank:
88
-447.90M
Peer Group Low
1.273B
Peer Group High
Date Unavailable
Risk
Performance Versus Peer Group
Annual Total Returns Versus Peers
As of May 31, 2026.
Asset Allocation
As of December 31, 2025.
| Type | % Net |
|---|---|
| Cash | 0.14% |
| Stock | 99.35% |
| Bond | 0.16% |
| Convertible | 0.00% |
| Preferred | 0.00% |
| Other | 0.36% |
Top 10 Holdings
| Name | % Weight | Price | % Change |
|---|---|---|---|
| KKR & Co., Inc. | 4.63% | 95.94 | 2.03% |
| 3i Group plc | 4.59% | 30.37 | -1.72% |
| HgCapital Trust Plc | 4.42% | 4.86 | 0.00% |
| Ares Management Corp. | 4.37% | 128.50 | 1.98% |
| Partners Group Holding AG | 4.19% | 1060.00 | -6.61% |
| Apollo Global Management, Inc. | 3.88% | 128.71 | 0.94% |
| Blackstone, Inc. | 3.69% | 116.97 | 0.71% |
|
Brederode SA ORD
|
3.69% | -- | -- |
| Berkshire Hathaway, Inc. | 3.64% | 474.48 | -0.62% |
| TPG, Inc. | 3.28% | 42.57 | 1.70% |
Fees & Availability
| Fees | |
| Actual 12B-1 Fee | 0.50% |
| Actual Management Fee | 0.83% |
| Administration Fee | 5.62K% |
| Maximum Front Load | -- |
| Maximum Deferred Load | -- |
| Maximum Redemption Fee | 0.00% |
| General Availability | |
| Available for Insurance Product | No |
| Available for RRSP | No |
| Purchase Details | |
| Open to New Investors |
|
| Minimum Initial Investment | 0.00 None |
| Minimum Subsequent Investment | 0.00 None |
Basic Info
| Investment Strategy | |
| The Fund seeks to maximize total return. The Fund will invest in (i) equity securities of U.S. and non-U.S. companies, including those in emerging markets, listed on a national securities exchange, or foreign equivalent, and (ii) derivatives, including options, futures, forwards, swap agreements and participation notes. |
| General | |
| Security Type | Mutual Fund |
| Equity Style | Multi Cap Growth |
| Broad Asset Class | Sector Equity |
| Broad Category | Equity |
| Global Peer Group | Equity Sector Financials |
| Peer Group | Global Financial Services Funds |
| Global Macro | Equity Industry Sector |
| US Macro | World Sector Equity Funds |
| YCharts Categorization | -- |
| YCharts Benchmark | -- |
| Prospectus Objective | Global Financial Services Funds |
| Fund Owner Firm Name | SS&C ALPS Advisors |
| Broad Asset Class Benchmark Index | |
| ^MSWNTR | 100.0% |
Fundamentals
| General | |
| Distribution Yield | -- |
| Dividend Yield TTM (5-28-26) | 9.65% |
| 30-Day SEC Yield (4-30-26) | 0.44% |
| 7-Day SEC Yield | -- |
| Number of Holdings | 50 |
| Stock | |
| Weighted Average PE Ratio | 33.12 |
| Weighted Average Price to Sales Ratio | 8.458 |
| Weighted Average Price to Book Ratio | 7.389 |
| Weighted Median ROE | 28.44% |
| Weighted Median ROA | 9.06% |
| ROI (TTM) | 11.92% |
| Return on Investment (TTM) | 11.92% |
| Earning Yield | 0.0450 |
| LT Debt / Shareholders Equity | 1.484 |
| Number of Equity Holdings | 48 |
As of December 31, 2025
Growth Metrics
| EPS Growth (1Y) | 23.01% |
| EPS Growth (3Y) | -0.72% |
| EPS Growth (5Y) | 19.02% |
| Sales Growth (1Y) | 19.96% |
| Sales Growth (3Y) | 4.95% |
| Sales Growth (5Y) | 17.77% |
| Sales per Share Growth (1Y) | 53.40% |
| Sales per Share Growth (3Y) | 3.40% |
| Operating Cash Flow - Growth Rate (3Y) | 11.75% |
As of December 31, 2025
Fund Details
Top Portfolio Holders
| Name | % Weight |
|---|---|
| Portfolio A | 5.00% |
| Portfolio B | 3.50% |
| Portfolio C | 2.25% |
Excel Add-In Codes
| Name: =YCI("M:LPERX", "name") |
| Broad Asset Class: =YCI("M:LPERX", "broad_asset_class") |
| Broad Category: =YCI("M:LPERX", "broad_category_group") |
| Prospectus Objective: =YCI("M:LPERX", "prospectus_objective") |
| To find the codes for any of our securities and financial metrics, see our Complete Excel Reference. |