

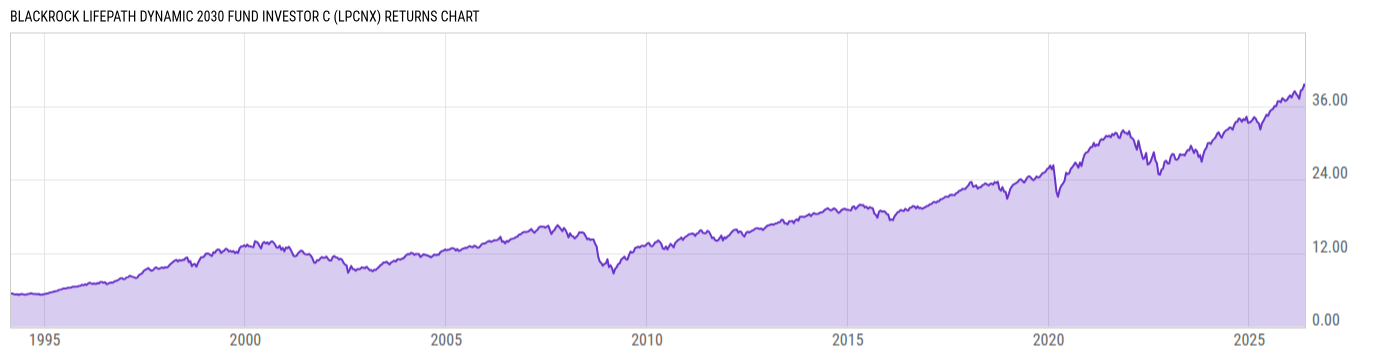
BlackRock LifePath Dynamic 2030 Fund Investor C (LPCNX)
14.99
+0.05
(+0.33%)
USD |
Jun 04 2026
Returns Chart
Key Stats
| Net Expense Ratio | Total Assets Under Management | Weighted Average Dividend Yield | Turnover Ratio (Generic) |
|---|---|---|---|
| 1.59% | 536.91M | -- | 19.00% |
| 1 Year Fund Level Flows | 1 Year Total Returns (Daily) | Annualized Total Returns Since Inception (Daily) | Max Drawdown (Since Inception) |
| -8.617M | 15.03% |
Basic Info
| Investment Strategy | |
| The Fund seeks to provide for retirement outcomes based on quantitatively measured risk. In pursuit of this objective, the Fund will be broadly diversified across global asset classes, with asset allocations becoming more conservative over time. |
| General | |
| Security Type | Mutual Fund |
| Equity Style | -- |
| Broad Asset Class | Allocation |
| Broad Category | Allocation |
| Global Peer Group | Target Maturity MA USD 2030 |
| Peer Group | Mixed-Asset Target 2030 Funds |
| Global Macro | Target Maturity |
| US Macro | Mixed-Assets Target Date Funds |
| YCharts Categorization | -- |
| YCharts Benchmark | -- |
| Prospectus Objective | Growth & Income Funds |
| Fund Owner Firm Name | BlackRock |
| Broad Asset Class Benchmark Index | |
| ^SPXTR | 100.0% |
Net Fund Flows Versus Peer Group
1 Month
% Rank:
54
-634.66M
Peer Group Low
234.84M
Peer Group High
1 Year
% Rank:
46
-8.617M
-4.669B
Peer Group Low
962.54M
Peer Group High
3 Months
% Rank:
50
-1.331B
Peer Group Low
542.00M
Peer Group High
3 Years
% Rank:
24
-9.883B
Peer Group Low
1.826B
Peer Group High
6 Months
% Rank:
53
-2.516B
Peer Group Low
918.80M
Peer Group High
5 Years
% Rank:
40
-18.10B
Peer Group Low
6.858B
Peer Group High
YTD
% Rank:
56
-1.975B
Peer Group Low
647.97M
Peer Group High
10 Years
% Rank:
77
-29.27B
Peer Group Low
17.94B
Peer Group High
Date Unavailable
Risk
Performance Versus Peer Group
Annual Total Returns Versus Peers
As of June 05, 2026.
Asset Allocation
As of November 30, 2025.
| Type | % Net |
|---|---|
| Cash | 3.02% |
| Stock | 13.50% |
| Bond | 16.61% |
| Convertible | 0.00% |
| Preferred | 0.09% |
| Other | 66.78% |
Top 10 Holdings
| Name | % Weight | Price | % Change |
|---|---|---|---|
|
DIVERSIFIED EQUITY MASTER FUND
|
31.23% | -- | -- |
|
DIVERSIFIED FIXED INCOME FUND
|
23.32% | -- | -- |
|
INTERNATIONAL TILTS MASTER PORTFOLIO
|
10.33% | -- | -- |
| iShares 0-5 Year TIPS Bond ETF | 8.75% | 102.34 | -0.18% |
| BlackRock Cash Funds: Treasury SL Agency | 6.54% | 1.00 | 0.00% |
| iShares Core MSCI Emerging Markets ETF | 5.42% | 80.72 | -3.92% |
| BlackRock Tactical Opportunities Fund K | 4.97% | 17.43 | 0.00% |
|
10Y TNOTES JUN26
|
4.06% | -- | -- |
| iShares Broad USD Investment Grade Corporate Bond | 3.81% | 50.96 | -0.35% |
|
5YR T NOTE JUN26
|
3.01% | -- | -- |
Fees & Availability
| Fees | |
| Actual 12B-1 Fee | 1.00% |
| Actual Management Fee | 0.10% |
| Administration Fee | 5.93K% |
| Maximum Front Load | -- |
| Maximum Deferred Load | 1.00% |
| Maximum Redemption Fee | -- |
| General Availability | |
| Available for Insurance Product | No |
| Available for RRSP | No |
| Purchase Details | |
| Open to New Investors |
|
| Minimum Initial Investment | 1000.00 None |
| Minimum Subsequent Investment | 50.00 None |
Basic Info
| Investment Strategy | |
| The Fund seeks to provide for retirement outcomes based on quantitatively measured risk. In pursuit of this objective, the Fund will be broadly diversified across global asset classes, with asset allocations becoming more conservative over time. |
| General | |
| Security Type | Mutual Fund |
| Equity Style | -- |
| Broad Asset Class | Allocation |
| Broad Category | Allocation |
| Global Peer Group | Target Maturity MA USD 2030 |
| Peer Group | Mixed-Asset Target 2030 Funds |
| Global Macro | Target Maturity |
| US Macro | Mixed-Assets Target Date Funds |
| YCharts Categorization | -- |
| YCharts Benchmark | -- |
| Prospectus Objective | Growth & Income Funds |
| Fund Owner Firm Name | BlackRock |
| Broad Asset Class Benchmark Index | |
| ^SPXTR | 100.0% |
Fundamentals
| General | |
| Distribution Yield | -- |
| Dividend Yield TTM (6-3-26) | 1.34% |
| 30-Day SEC Yield | -- |
| 7-Day SEC Yield | -- |
| Number of Holdings | 10 |
Fund Details
Top Portfolio Holders
| Name | % Weight |
|---|---|
| Portfolio A | 5.00% |
| Portfolio B | 3.50% |
| Portfolio C | 2.25% |
Excel Add-In Codes
| Name: =YCI("M:LPCNX", "name") |
| Broad Asset Class: =YCI("M:LPCNX", "broad_asset_class") |
| Broad Category: =YCI("M:LPCNX", "broad_category_group") |
| Prospectus Objective: =YCI("M:LPCNX", "prospectus_objective") |
| To find the codes for any of our securities and financial metrics, see our Complete Excel Reference. |