

American Funds Global Growth Fund 4 (LP40202191)
38.24
+0.31
(+0.82%)
USD |
Jun 09 2026
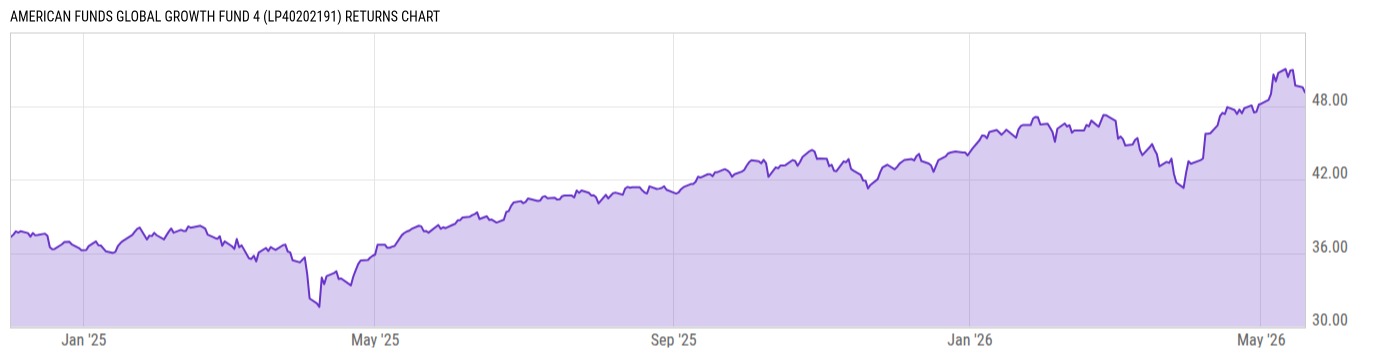
Returns Chart
Key Stats
| Net Expense Ratio | Total Assets Under Management | Weighted Average Dividend Yield | Turnover Ratio (Generic) |
|---|---|---|---|
| 0.90% | 10.59B | 1.39% | 45.00% |
| 1 Year Fund Level Flows | 1 Year Total Returns (Daily) | Annualized Total Returns Since Inception (Daily) | Max Drawdown (Since Inception) |
| -656.32M | 30.62% |
Basic Info
| Investment Strategy | |
| The Fund seeks to achieve long-term growth of capital by investing in securities of issuers domiciled around the world. The Fund will invest primarily in common stocks but may invest in other securities such as preferred stock , debt securities, and securities convertible into common stock. |
| General | |
| Security Type | Insurance Fund |
| Equity Style | Large Cap Growth |
| Broad Asset Class | International Equity |
| Broad Category | Equity |
| Global Peer Group | Equity Global |
| Peer Group | Global Large-Cap Growth |
| Global Macro | Equity Global |
| US Macro | Developed Global Markets Funds |
| YCharts Categorization | -- |
| YCharts Benchmark | -- |
| Prospectus Objective | Global Funds |
| Fund Owner Firm Name | Capital Group/American Funds |
| Broad Asset Class Benchmark Index | |
| ^MSACXUSNTR | 100.0% |
Net Fund Flows Versus Peer Group
1 Month
% Rank:
84
-692.03M
Peer Group Low
210.80M
Peer Group High
1 Year
% Rank:
84
-656.32M
-8.255B
Peer Group Low
5.269B
Peer Group High
3 Months
% Rank:
83
-1.507B
Peer Group Low
658.44M
Peer Group High
3 Years
% Rank:
85
-19.14B
Peer Group Low
6.112B
Peer Group High
6 Months
% Rank:
84
-4.994B
Peer Group Low
1.590B
Peer Group High
5 Years
% Rank:
83
-28.64B
Peer Group Low
7.720B
Peer Group High
YTD
% Rank:
84
-2.889B
Peer Group Low
1.472B
Peer Group High
10 Years
% Rank:
89
-29.44B
Peer Group Low
7.720B
Peer Group High
Date Unavailable
Risk
Performance Versus Peer Group
Annual Total Returns Versus Peers
As of June 10, 2026.
Asset Allocation
As of March 31, 2026.
| Type | % Net |
|---|---|
| Cash | 2.79% |
| Stock | 97.01% |
| Bond | 0.00% |
| Convertible | 0.00% |
| Preferred | 0.00% |
| Other | 0.20% |
Top 10 Holdings
| Name | % Weight | Price | % Change |
|---|---|---|---|
| Taiwan Semiconductor Manufacturing Co., Ltd. | 6.37% | 17.24 | 0.00% |
|
SK Hynix Inc ORD
|
3.31% | -- | -- |
| Broadcom Inc. | 3.12% | 374.90 | -4.40% |
| Micron Technology, Inc. | 3.10% | 906.46 | -3.14% |
|
Capital Group Central Cash Fund; Class M
|
2.79% | -- | -- |
| Microsoft Corp. | 1.99% | 401.58 | -0.45% |
| Alphabet, Inc. | 1.89% | 361.50 | -0.76% |
| NVIDIA Corp. | 1.60% | 202.53 | -2.72% |
| Citigroup, Inc. | 1.41% | 132.92 | -1.34% |
| ASML Holding NV | 1.39% | 1683.72 | -3.25% |
Fees & Availability
| Fees | |
| Actual 12B-1 Fee | 0.25% |
| Actual Management Fee | 0.36% |
| Administration Fee | -- |
| Maximum Front Load | -- |
| Maximum Deferred Load | -- |
| Maximum Redemption Fee | -- |
| General Availability | |
| Available for Insurance Product |
|
| Available for RRSP | No |
| Purchase Details | |
| Open to New Investors |
|
| Minimum Initial Investment | 0.00 None |
| Minimum Subsequent Investment | 0.00 None |
Basic Info
| Investment Strategy | |
| The Fund seeks to achieve long-term growth of capital by investing in securities of issuers domiciled around the world. The Fund will invest primarily in common stocks but may invest in other securities such as preferred stock , debt securities, and securities convertible into common stock. |
| General | |
| Security Type | Insurance Fund |
| Equity Style | Large Cap Growth |
| Broad Asset Class | International Equity |
| Broad Category | Equity |
| Global Peer Group | Equity Global |
| Peer Group | Global Large-Cap Growth |
| Global Macro | Equity Global |
| US Macro | Developed Global Markets Funds |
| YCharts Categorization | -- |
| YCharts Benchmark | -- |
| Prospectus Objective | Global Funds |
| Fund Owner Firm Name | Capital Group/American Funds |
| Broad Asset Class Benchmark Index | |
| ^MSACXUSNTR | 100.0% |
Fundamentals
| General | |
| Distribution Yield | -- |
| Dividend Yield TTM (6-9-26) | 1.48% |
| 30-Day SEC Yield (4-30-26) | 0.61% |
| 7-Day SEC Yield | -- |
| Number of Holdings | 171 |
| Stock | |
| Weighted Average PE Ratio | 28.25 |
| Weighted Average Price to Sales Ratio | 6.828 |
| Weighted Average Price to Book Ratio | 7.779 |
| Weighted Median ROE | 32.35% |
| Weighted Median ROA | 12.85% |
| ROI (TTM) | 18.87% |
| Return on Investment (TTM) | 18.87% |
| Earning Yield | 0.0512 |
| LT Debt / Shareholders Equity | 0.7111 |
| Number of Equity Holdings | 169 |
As of March 31, 2026
Growth Metrics
| EPS Growth (1Y) | 33.59% |
| EPS Growth (3Y) | 18.73% |
| EPS Growth (5Y) | 24.46% |
| Sales Growth (1Y) | 18.10% |
| Sales Growth (3Y) | 14.34% |
| Sales Growth (5Y) | 16.42% |
| Sales per Share Growth (1Y) | 18.44% |
| Sales per Share Growth (3Y) | 14.80% |
| Operating Cash Flow - Growth Rate (3Y) | 17.50% |
As of March 31, 2026
Fund Details
| Key Dates | |
| Launch Date | 12/14/2012 |
| Last Annual Report Date | 12/31/2025 |
| Last Prospectus Date | 5/1/2026 |
| Share Classes | |
| LP40027891 | Other |
| LP40028330 | Other |
| LP40217853 | Other |
| Attributes | |
| Index Fund | -- |
| Inverse Fund | No |
| Leveraged Fund | -- |
| Fund of Funds | No |
| Currency Hedged Fund | -- |
| Socially Responsible Fund | No |
Top Portfolio Holders
| Name | % Weight |
|---|---|
| Portfolio A | 5.00% |
| Portfolio B | 3.50% |
| Portfolio C | 2.25% |