

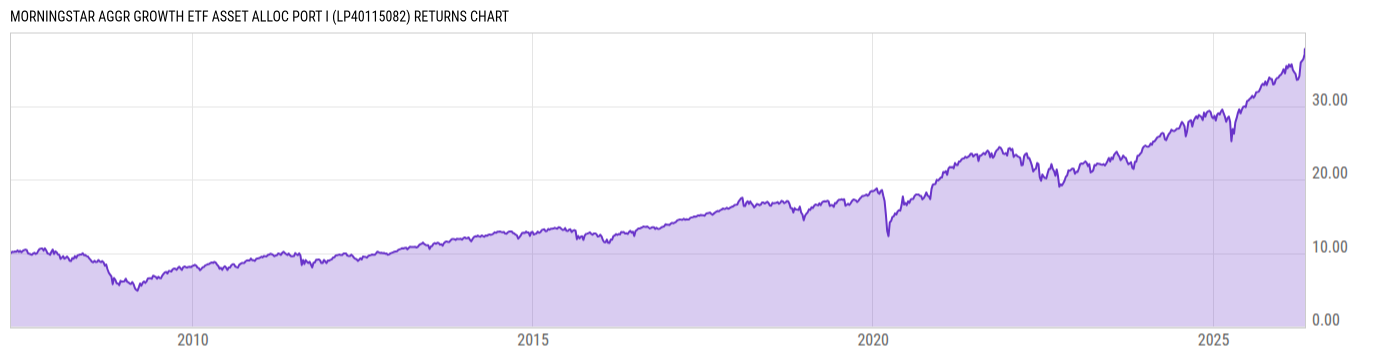
Morningstar Aggr Growth ETF Asset Alloc Port I (LP40115082)
19.58
+0.09
(+0.46%)
USD |
May 28 2026
Returns Chart
Key Stats
| Net Expense Ratio | Total Assets Under Management | Weighted Average Dividend Yield | Turnover Ratio (Generic) |
|---|---|---|---|
| 0.60% | 262.81M | -- | 14.00% |
| 1 Year Fund Level Flows | 1 Year Total Returns (Daily) | Annualized Total Returns Since Inception (Daily) | Max Drawdown (Since Inception) |
| -767317.0 | 31.54% |
Basic Info
| Investment Strategy | |
| The Fund seeks to provide investors with capital appreciation. The Fund is a "fund-of-funds" and seeks to achieve its investment objective by investing primarily in a portfolio of Underlying ETFs. The Fund typically invests 90% of its assets in equity ETFs. |
| General | |
| Security Type | Insurance Fund |
| Equity Style | -- |
| Broad Asset Class | US Equity |
| Broad Category | Equity |
| Global Peer Group | Equity US |
| Peer Group | Multi-Cap Core Funds |
| Global Macro | Equity North America |
| US Macro | Multi-Cap Funds |
| YCharts Categorization | -- |
| YCharts Benchmark | -- |
| Prospectus Objective | Growth & Income Funds |
| Fund Owner Firm Name | SS&C ALPS Advisors |
| Broad Asset Class Benchmark Index | |
| ^SPXTR | 100.0% |
Net Fund Flows Versus Peer Group
1 Month
% Rank:
20
-2.567B
Peer Group Low
4.060B
Peer Group High
1 Year
% Rank:
30
-767317.0
-37.69B
Peer Group Low
40.70B
Peer Group High
3 Months
% Rank:
44
-637.71M
Peer Group Low
17.31B
Peer Group High
3 Years
% Rank:
33
-29.31B
Peer Group Low
86.13B
Peer Group High
6 Months
% Rank:
30
-1.164B
Peer Group Low
28.18B
Peer Group High
5 Years
% Rank:
31
-19.00B
Peer Group Low
102.57B
Peer Group High
YTD
% Rank:
35
-759.70M
Peer Group Low
23.44B
Peer Group High
10 Years
% Rank:
37
-55.10B
Peer Group Low
209.18B
Peer Group High
Date Unavailable
Risk
Performance Versus Peer Group
Annual Total Returns Versus Peers
As of May 29, 2026.
Asset Allocation
As of March 31, 2026.
| Type | % Net |
|---|---|
| Cash | 0.04% |
| Stock | 93.56% |
| Bond | 4.66% |
| Convertible | 0.00% |
| Preferred | 0.35% |
| Other | 1.38% |
Top 10 Holdings
| Name | % Weight | Price | % Change |
|---|---|---|---|
| Vanguard Total Stock Market Index Fund ETF | 24.75% | 372.45 | 0.21% |
| iShares Core S&P 500 ETF | 16.79% | 760.24 | 0.27% |
| Vanguard Developed Markets Index Fund ETF | 13.02% | 71.76 | 0.13% |
| Schwab Fundamental Intl Equity ETF | 9.24% | 54.38 | 0.30% |
| Vanguard Small-Cap Index Fund ETF | 8.10% | 293.57 | -0.15% |
| iShares S&P 100 ETF | 6.40% | 377.07 | 0.16% |
| Vanguard Emerging Markets Stock Index Fund ETF | 5.54% | 59.90 | -0.01% |
| Vanguard Mega Cap Growth Index Fund ETF | 3.92% | 91.31 | 0.62% |
| iShares MSCI Emerging Markets ex China ETF | 3.55% | 101.06 | 0.03% |
| iShares Core S&P Mid-Cap ETF | 3.53% | 74.61 | 0.21% |
Fees & Availability
| Fees | |
| Actual 12B-1 Fee | -- |
| Actual Management Fee | 0.45% |
| Administration Fee | 7.31K% |
| Maximum Front Load | -- |
| Maximum Deferred Load | -- |
| Maximum Redemption Fee | -- |
| General Availability | |
| Available for Insurance Product |
|
| Available for RRSP | No |
| Purchase Details | |
| Open to New Investors |
|
| Minimum Initial Investment | 0.00 None |
| Minimum Subsequent Investment | 0.00 None |
Basic Info
| Investment Strategy | |
| The Fund seeks to provide investors with capital appreciation. The Fund is a "fund-of-funds" and seeks to achieve its investment objective by investing primarily in a portfolio of Underlying ETFs. The Fund typically invests 90% of its assets in equity ETFs. |
| General | |
| Security Type | Insurance Fund |
| Equity Style | -- |
| Broad Asset Class | US Equity |
| Broad Category | Equity |
| Global Peer Group | Equity US |
| Peer Group | Multi-Cap Core Funds |
| Global Macro | Equity North America |
| US Macro | Multi-Cap Funds |
| YCharts Categorization | -- |
| YCharts Benchmark | -- |
| Prospectus Objective | Growth & Income Funds |
| Fund Owner Firm Name | SS&C ALPS Advisors |
| Broad Asset Class Benchmark Index | |
| ^SPXTR | 100.0% |
Fundamentals
| General | |
| Distribution Yield | -- |
| Dividend Yield TTM (5-28-26) | 1.20% |
| 30-Day SEC Yield | -- |
| 7-Day SEC Yield | -- |
| Number of Holdings | 14 |
| Stock | |
| Weighted Average PE Ratio | 28.17 |
| Weighted Average Price to Sales Ratio | 6.282 |
| Weighted Average Price to Book Ratio | 7.964 |
| Weighted Median ROE | 74.89% |
| Weighted Median ROA | 13.41% |
| ROI (TTM) | 28.40% |
| Return on Investment (TTM) | 28.40% |
| Earning Yield | 0.0489 |
| LT Debt / Shareholders Equity | 0.7456 |
| Number of Equity Holdings | 0 |
As of March 31, 2026
Growth Metrics
| EPS Growth (1Y) | 22.09% |
| EPS Growth (3Y) | 15.72% |
| EPS Growth (5Y) | 21.74% |
| Sales Growth (1Y) | 13.17% |
| Sales Growth (3Y) | 12.36% |
| Sales Growth (5Y) | 14.28% |
| Sales per Share Growth (1Y) | 31.79% |
| Sales per Share Growth (3Y) | 12.79% |
| Operating Cash Flow - Growth Rate (3Y) | 21.65% |
As of March 31, 2026
Fund Details
| Key Dates | |
| Launch Date | 4/30/2007 |
| Last Annual Report Date | 12/31/2025 |
| Last Prospectus Date | 4/30/2026 |
| Share Classes | |
| AGTFX | Other |
| Attributes | |
| Index Fund | -- |
| Inverse Fund | No |
| Leveraged Fund | -- |
| Fund of Funds |
|
| Currency Hedged Fund | -- |
| Socially Responsible Fund | No |
Top Portfolio Holders
| Name | % Weight |
|---|---|
| Portfolio A | 5.00% |
| Portfolio B | 3.50% |
| Portfolio C | 2.25% |