

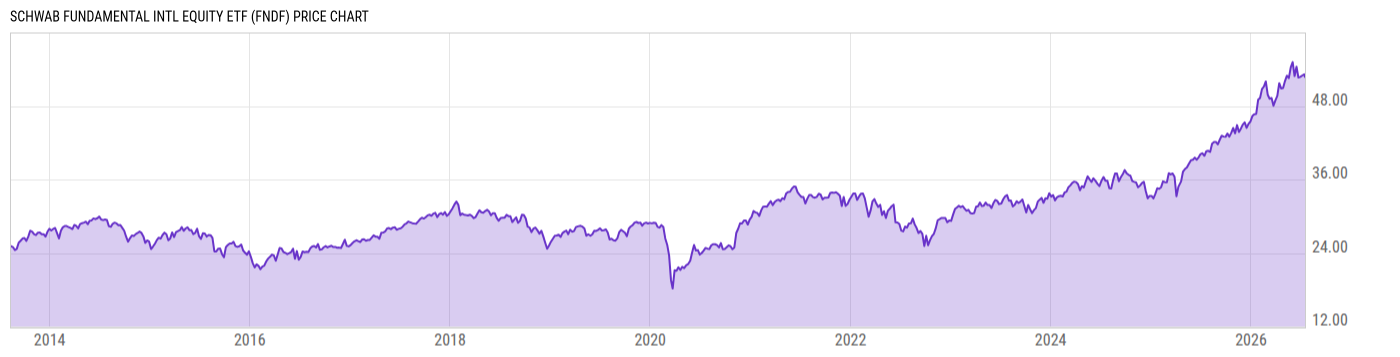
Schwab Fundamental Intl Equity ETF (FNDF)
52.74
-0.09
(-0.17%)
USD |
NYSEARCA |
Jul 17, 16:00
52.72
-0.02
(-0.05%)
After-Hours: 20:00
Price Chart
Key Stats
| Net Expense Ratio | Discount or Premium to NAV | Total Assets Under Management | 30-Day Average Daily Volume |
|---|---|---|---|
| 0.25% | 0.01% | 24.22B | 1.335M |
| Weighted Average Dividend Yield | Turnover Ratio (Generic) | 1 Year Fund Level Flows | Max Drawdown (Since Inception) |
| 2.84% | 11.00% | 1.532B |
Basic Info
| Investment Strategy | |
| The Fund seeks to track as closely as possible the total return of an index that measures the performance of large non-U.S. developed market companies based on their fundamental size and weight. The fund generally invests in stocks that are included in the RAFI Fundamental High Liquidity Developed ex US Large Index. |
| General | |
| Security Type | Exchange-Traded Fund |
| Equity Style | Large Cap Value |
| Broad Asset Class | International Equity |
| Broad Category | Equity |
| Global Peer Group | Equity Global ex US |
| Peer Group | International Large-Cap Value |
| Global Macro | Equity Global |
| US Macro | Developed International Markets Funds |
| YCharts Categorization | -- |
| YCharts Benchmark | -- |
| Prospectus Objective | International Funds |
| Fund Owner Firm Name | Charles Schwab |
| Broad Asset Class Benchmark Index | |
| ^MSACXUSNTR | 100.0% |
Performance Versus Peer Group
Annual Total Returns Versus Peers
As of July 19, 2026.
Asset Allocation
As of June 30, 2026.
| Type | % Net |
|---|---|
| Cash | 0.32% |
| Stock | 98.26% |
| Bond | 0.08% |
| Convertible | 0.00% |
| Preferred | 1.14% |
| Other | 0.21% |
Basic Info
| Investment Strategy | |
| The Fund seeks to track as closely as possible the total return of an index that measures the performance of large non-U.S. developed market companies based on their fundamental size and weight. The fund generally invests in stocks that are included in the RAFI Fundamental High Liquidity Developed ex US Large Index. |
| General | |
| Security Type | Exchange-Traded Fund |
| Equity Style | Large Cap Value |
| Broad Asset Class | International Equity |
| Broad Category | Equity |
| Global Peer Group | Equity Global ex US |
| Peer Group | International Large-Cap Value |
| Global Macro | Equity Global |
| US Macro | Developed International Markets Funds |
| YCharts Categorization | -- |
| YCharts Benchmark | -- |
| Prospectus Objective | International Funds |
| Fund Owner Firm Name | Charles Schwab |
| Broad Asset Class Benchmark Index | |
| ^MSACXUSNTR | 100.0% |