

JNL/Franklin Templeton Income Fund I (LP40108900)
18.85
-0.02
(-0.11%)
USD |
Jun 08 2026
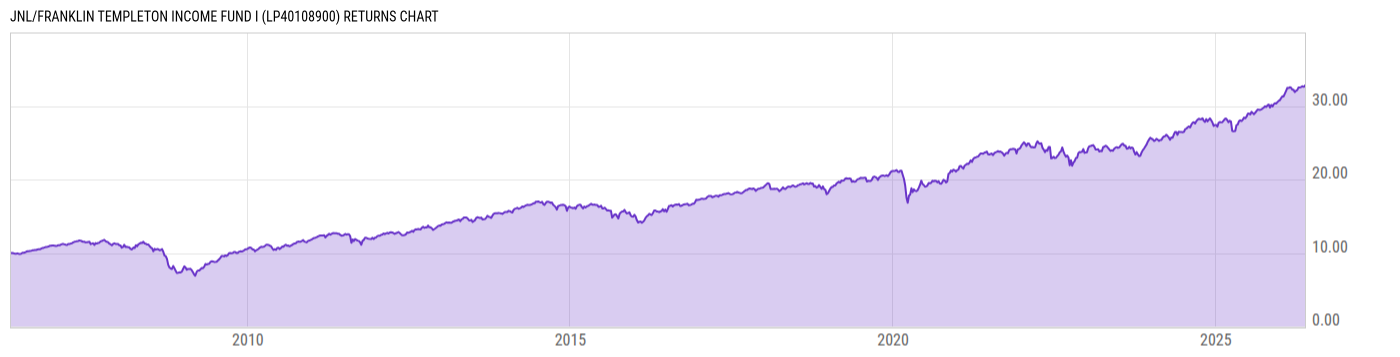
Returns Chart
Key Stats
| Net Expense Ratio | Total Assets Under Management | Weighted Average Dividend Yield | Turnover Ratio (Generic) |
|---|---|---|---|
| 0.62% | 1.415B | -- | 37.00% |
| 1 Year Fund Level Flows | 1 Year Total Returns (Daily) | Annualized Total Returns Since Inception (Daily) | Max Drawdown (Since Inception) |
| -185.56M | 16.14% |
Basic Info
| Investment Strategy | |
| The Fund seeks to maximize income while maintaining prospects for capital appreciation. The Fund invests in a diversified portfolio of debt and equity securities. The equity securities in which the Fund invests consist primarily of common stock. The Fund may lend its securities to increase its income. |
| General | |
| Security Type | Insurance Fund |
| Equity Style | -- |
| Broad Asset Class | Allocation |
| Broad Category | Allocation |
| Global Peer Group | Mixed Asset USD Conservative |
| Peer Group | Mixed-Asset Target Alloc Consv Funds |
| Global Macro | Mixed Asset HC Conservative |
| US Macro | Mixed-Assets Target Allocation Funds |
| YCharts Categorization | -- |
| YCharts Benchmark | -- |
| Prospectus Objective | Income Funds |
| Fund Owner Firm Name | Jackson |
| Broad Asset Class Benchmark Index | |
| ^SPXTR | 100.0% |
Net Fund Flows Versus Peer Group
1 Month
% Rank:
89
-441.51M
Peer Group Low
18.88M
Peer Group High
1 Year
% Rank:
88
-185.56M
-4.963B
Peer Group Low
619.48M
Peer Group High
3 Months
% Rank:
87
-1.227B
Peer Group Low
284.45M
Peer Group High
3 Years
% Rank:
87
-19.17B
Peer Group Low
597.52M
Peer Group High
6 Months
% Rank:
86
-2.547B
Peer Group Low
635.87M
Peer Group High
5 Years
% Rank:
82
-25.78B
Peer Group Low
585.76M
Peer Group High
YTD
% Rank:
87
-1.956B
Peer Group Low
637.42M
Peer Group High
10 Years
% Rank:
91
-25.25B
Peer Group Low
948.31M
Peer Group High
Date Unavailable
Risk
Performance Versus Peer Group
Annual Total Returns Versus Peers
As of June 10, 2026.
Asset Allocation
As of March 31, 2026.
| Type | % Net |
|---|---|
| Cash | 0.20% |
| Stock | 33.41% |
| Bond | 61.87% |
| Convertible | 0.00% |
| Preferred | 1.63% |
| Other | 2.88% |
Top 10 Holdings
| Name | % Weight | Price | % Change |
|---|---|---|---|
| Exxon Mobil Corp. | 2.39% | 148.91 | -1.87% |
| Chevron Corp. | 2.26% | 186.76 | -1.31% |
| Procter & Gamble Co. | 1.88% | 148.67 | 2.46% |
| United States of America USGB 05/05/2026 FIX USD Government (Matured) | 1.75% | 100.00 | 0.01% |
| CHS/Community Health Systems, Inc. COMMHS 10.875 01/15/2032 FIX USD Corporate 144A | 1.48% | 106.81 | 0.01% |
| TENET HEALTHCARE CORPORATION THC 6.125 06/15/2030 FIX USD Corporate | 1.44% | 100.63 | -0.05% |
| The Southern Co. | 1.43% | 92.95 | 1.83% |
| United States of America USGB 0.0 11/15/2054 FIX USD Government | 1.27% | 23.98 | 0.96% |
| PepsiCo, Inc. | 1.26% | 142.78 | 1.49% |
| Cisco Systems, Inc. | 1.23% | 120.36 | -3.05% |
Fees & Availability
| Fees | |
| Actual 12B-1 Fee | -- |
| Actual Management Fee | 0.51% |
| Administration Fee | 8.06K% |
| Maximum Front Load | -- |
| Maximum Deferred Load | -- |
| Maximum Redemption Fee | -- |
| General Availability | |
| Available for Insurance Product |
|
| Available for RRSP | No |
| Purchase Details | |
| Open to New Investors |
|
| Minimum Initial Investment | 0.00 None |
| Minimum Subsequent Investment | 0.00 None |
Basic Info
| Investment Strategy | |
| The Fund seeks to maximize income while maintaining prospects for capital appreciation. The Fund invests in a diversified portfolio of debt and equity securities. The equity securities in which the Fund invests consist primarily of common stock. The Fund may lend its securities to increase its income. |
| General | |
| Security Type | Insurance Fund |
| Equity Style | -- |
| Broad Asset Class | Allocation |
| Broad Category | Allocation |
| Global Peer Group | Mixed Asset USD Conservative |
| Peer Group | Mixed-Asset Target Alloc Consv Funds |
| Global Macro | Mixed Asset HC Conservative |
| US Macro | Mixed-Assets Target Allocation Funds |
| YCharts Categorization | -- |
| YCharts Benchmark | -- |
| Prospectus Objective | Income Funds |
| Fund Owner Firm Name | Jackson |
| Broad Asset Class Benchmark Index | |
| ^SPXTR | 100.0% |
Fundamentals
| General | |
| Distribution Yield | -- |
| Dividend Yield TTM (6-8-26) | 0.00% |
| 30-Day SEC Yield (5-31-26) | 5.29% |
| 7-Day SEC Yield | -- |
| Number of Holdings | 273 |
| Stock | |
| Weighted Average PE Ratio | 25.75 |
| Weighted Average Price to Sales Ratio | 3.744 |
| Weighted Average Price to Book Ratio | 5.405 |
| Weighted Median ROE | 214.2% |
| Weighted Median ROA | 7.03% |
| ROI (TTM) | 9.76% |
| Return on Investment (TTM) | 9.76% |
| Earning Yield | 0.0441 |
| LT Debt / Shareholders Equity | 0.8482 |
| Number of Equity Holdings | 59 |
| Bond | |
| Yield to Maturity (3-31-26) | 5.64% |
| Effective Duration | 5.74 |
| Average Coupon | 7.52% |
| Calculated Average Quality | 4.853 |
| Effective Maturity | 7.480 |
| Nominal Maturity | 7.602 |
| Number of Bond Holdings | 201 |
As of March 31, 2026
Growth Metrics
| EPS Growth (1Y) | 0.26% |
| EPS Growth (3Y) | -1.54% |
| EPS Growth (5Y) | 11.54% |
| Sales Growth (1Y) | 3.44% |
| Sales Growth (3Y) | 0.32% |
| Sales Growth (5Y) | 7.27% |
| Sales per Share Growth (1Y) | 2.91% |
| Sales per Share Growth (3Y) | 0.96% |
| Operating Cash Flow - Growth Rate (3Y) | 2.14% |
As of March 31, 2026
Fund Details
| Key Dates | |
| Launch Date | 5/1/2006 |
| Last Annual Report Date | 12/31/2025 |
| Last Prospectus Date | 4/27/2026 |
| Share Classes | |
| LP40108899 | A |
| Attributes | |
| Index Fund | -- |
| Inverse Fund | No |
| Leveraged Fund | -- |
| Fund of Funds | No |
| Currency Hedged Fund | -- |
| Socially Responsible Fund | No |
Top Portfolio Holders
| Name | % Weight |
|---|---|
| Portfolio A | 5.00% |
| Portfolio B | 3.50% |
| Portfolio C | 2.25% |