

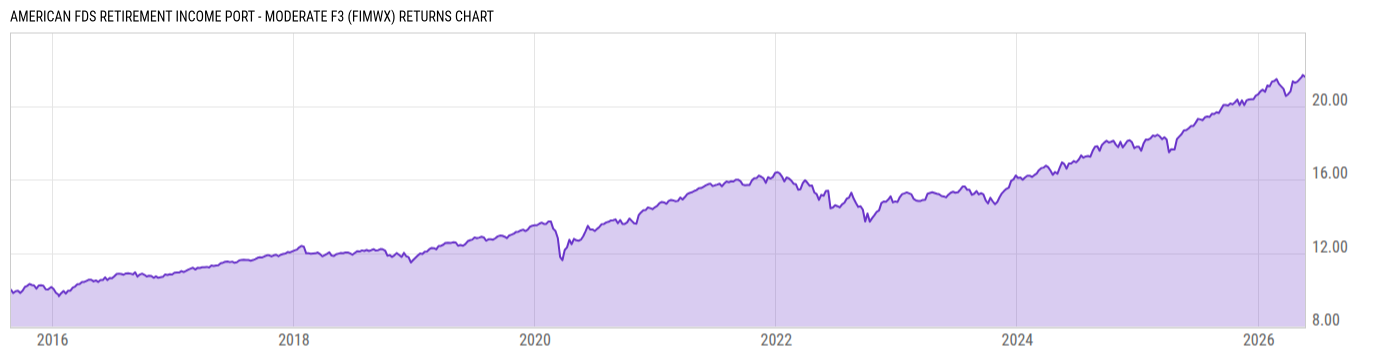
American Fds Retirement Income Port - Moderate F3 (FIMWX)
14.22
+0.05
(+0.35%)
USD |
Jun 09 2026
Returns Chart
Key Stats
| Net Expense Ratio | Total Assets Under Management | Weighted Average Dividend Yield | Turnover Ratio (Generic) |
|---|---|---|---|
| 0.31% | 1.749B | -- | 6.00% |
| 1 Year Fund Level Flows | 1 Year Total Returns (Daily) | Annualized Total Returns Since Inception (Daily) | Max Drawdown (Since Inception) |
| -20.46M | 14.41% |
Basic Info
| Investment Strategy | |
| The Fund seeks current income, long-term growth of capital and conservation of capital. The Fund is designed for investors who desire a balanced approach to downside risk, income and growth of capital. It is intended primarily for investors who are already in retirement or plan to retire in the near future. |
| General | |
| Security Type | Mutual Fund |
| Equity Style | -- |
| Broad Asset Class | Allocation |
| Broad Category | Allocation |
| Global Peer Group | Mixed Asset USD Balanced - US |
| Peer Group | Retirement Income Funds |
| Global Macro | Mixed Asset HC Balanced |
| US Macro | Mixed-Assets Target Allocation Funds |
| YCharts Categorization | -- |
| YCharts Benchmark | -- |
| Prospectus Objective | Income Funds |
| Fund Owner Firm Name | Capital Group/American Funds |
| Broad Asset Class Benchmark Index | |
| ^SPXTR | 100.0% |
Net Fund Flows Versus Peer Group
1 Month
% Rank:
50
-6.299M
Peer Group Low
16.42M
Peer Group High
1 Year
% Rank:
92
-20.46M
-20.46M
Peer Group Low
88.02M
Peer Group High
3 Months
% Rank:
92
-6.844M
Peer Group Low
31.86M
Peer Group High
3 Years
% Rank:
72
-201.56M
Peer Group Low
26.59M
Peer Group High
6 Months
% Rank:
92
-10.03M
Peer Group Low
40.68M
Peer Group High
5 Years
% Rank:
72
-160.56M
Peer Group Low
187.69M
Peer Group High
YTD
% Rank:
77
-4.823M
Peer Group Low
45.71M
Peer Group High
10 Years
% Rank:
50
-49.44M
Peer Group Low
1.052B
Peer Group High
Date Unavailable
Risk
Performance Versus Peer Group
Annual Total Returns Versus Peers
As of June 10, 2026.
Asset Allocation
As of March 31, 2026.
| Type | % Net |
|---|---|
| Cash | 5.12% |
| Stock | 52.41% |
| Bond | 40.50% |
| Convertible | 0.00% |
| Preferred | 0.39% |
| Other | 1.58% |
Top 10 Holdings
| Name | % Weight | Price | % Change |
|---|---|---|---|
| American Funds Income Fund of America R6 | 20.09% | 27.46 | 0.44% |
| American Funds Capital Income Builder R6 | 18.04% | 81.45 | 0.47% |
| American Funds American Balanced Fund R6 | 14.90% | 40.39 | 0.27% |
| American Funds Multi-Sector Income Fund R6 | 9.07% | 9.34 | 0.11% |
| American Funds Bond Fund of America R6 | 8.05% | 11.22 | 0.18% |
| American Funds US Government Securities Fd R6 | 7.05% | 11.84 | 0.17% |
| American Funds Capital World Gro & Inc Fd R6 | 6.90% | 80.15 | 0.09% |
| American Funds Strategic Bond Fund R6 | 6.04% | 9.15 | 0.33% |
| American Funds Global Balanced Fund R6 | 4.96% | 41.98 | 0.00% |
| American Funds American Mutual Fund R6 | 4.94% | 62.99 | 0.61% |
Fees & Availability
| Fees | |
| Actual 12B-1 Fee | -- |
| Actual Management Fee | 0.00% |
| Administration Fee | -- |
| Maximum Front Load | -- |
| Maximum Deferred Load | -- |
| Maximum Redemption Fee | -- |
| General Availability | |
| Available for Insurance Product | No |
| Available for RRSP | No |
| Purchase Details | |
| Open to New Investors |
|
| Minimum Initial Investment | 250.00 None |
| Minimum Subsequent Investment | 50.00 None |
Basic Info
| Investment Strategy | |
| The Fund seeks current income, long-term growth of capital and conservation of capital. The Fund is designed for investors who desire a balanced approach to downside risk, income and growth of capital. It is intended primarily for investors who are already in retirement or plan to retire in the near future. |
| General | |
| Security Type | Mutual Fund |
| Equity Style | -- |
| Broad Asset Class | Allocation |
| Broad Category | Allocation |
| Global Peer Group | Mixed Asset USD Balanced - US |
| Peer Group | Retirement Income Funds |
| Global Macro | Mixed Asset HC Balanced |
| US Macro | Mixed-Assets Target Allocation Funds |
| YCharts Categorization | -- |
| YCharts Benchmark | -- |
| Prospectus Objective | Income Funds |
| Fund Owner Firm Name | Capital Group/American Funds |
| Broad Asset Class Benchmark Index | |
| ^SPXTR | 100.0% |
Fundamentals
| General | |
| Distribution Yield | -- |
| Dividend Yield TTM (6-8-26) | 3.34% |
| 30-Day SEC Yield (4-30-26) | 3.04% |
| 7-Day SEC Yield | -- |
| Number of Holdings | 11 |
| Stock | |
| Weighted Average PE Ratio | 27.66 |
| Weighted Average Price to Sales Ratio | 6.385 |
| Weighted Average Price to Book Ratio | 7.189 |
| Weighted Median ROE | 54.37% |
| Weighted Median ROA | 9.99% |
| ROI (TTM) | 15.60% |
| Return on Investment (TTM) | 15.60% |
| Earning Yield | 0.0476 |
| LT Debt / Shareholders Equity | 1.216 |
| Number of Equity Holdings | 0 |
| Bond | |
| Yield to Maturity (3-31-26) | 4.70% |
| Effective Duration | 6.30 |
| Average Coupon | 5.02% |
| Calculated Average Quality | 3.280 |
| Effective Maturity | 13.19 |
| Nominal Maturity | 13.31 |
| Number of Bond Holdings | 0 |
As of March 31, 2026
Growth Metrics
| EPS Growth (1Y) | 21.36% |
| EPS Growth (3Y) | 9.53% |
| EPS Growth (5Y) | 14.90% |
| Sales Growth (1Y) | 10.81% |
| Sales Growth (3Y) | 9.51% |
| Sales Growth (5Y) | 9.79% |
| Sales per Share Growth (1Y) | 11.65% |
| Sales per Share Growth (3Y) | 9.87% |
| Operating Cash Flow - Growth Rate (3Y) | 9.03% |
As of March 31, 2026
Fund Details
| Key Dates | |
| Inception Date | 8/28/2015 |
| Last Annual Report Date | 10/31/2025 |
| Last Prospectus Date | 1/1/2026 |
| Share Classes | |
| FBFWX | Other |
| FHFWX | Other |
| NBARX | A |
| NBCRX | C |
| RBRPX | Retirement |
| RERPX | Retirement |
| RHRPX | Other |
| RKRPX | Retirement |
| RNRPX | Retirement |
| RRPPX | Other |
| RRRPX | Retirement |
| RURPX | Retirement |
| Attributes | |
| Index Fund | -- |
| Inverse Fund | No |
| Leveraged Fund | -- |
| Fund of Funds |
|
| Currency Hedged Fund | -- |
| Socially Responsible Fund | No |
Top Portfolio Holders
| Name | % Weight |
|---|---|
| Portfolio A | 5.00% |
| Portfolio B | 3.50% |
| Portfolio C | 2.25% |
Excel Add-In Codes
| Name: =YCI("M:FIMWX", "name") |
| Broad Asset Class: =YCI("M:FIMWX", "broad_asset_class") |
| Broad Category: =YCI("M:FIMWX", "broad_category_group") |
| Prospectus Objective: =YCI("M:FIMWX", "prospectus_objective") |
| To find the codes for any of our securities and financial metrics, see our Complete Excel Reference. |