

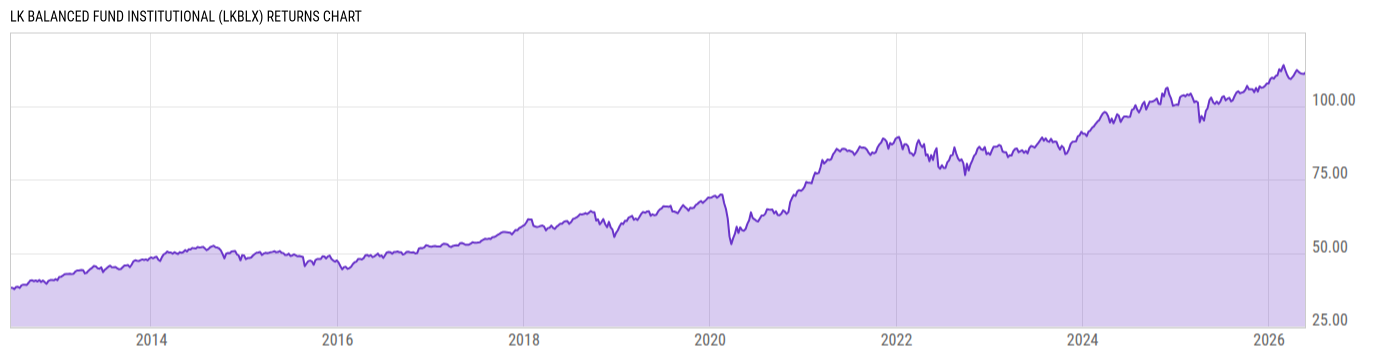
LK Balanced Fund Institutional (LKBLX)
52.03
+0.27
(+0.52%)
USD |
Jun 09 2026
Returns Chart
Key Stats
| Net Expense Ratio | Total Assets Under Management | Weighted Average Dividend Yield | Turnover Ratio (Generic) |
|---|---|---|---|
| 1.00% | 26.03M | 1.46% | 10.00% |
| 1 Year Fund Level Flows | 1 Year Total Returns (Daily) | Annualized Total Returns Since Inception (Daily) | Max Drawdown (Since Inception) |
| -2.738M | 10.82% |
Basic Info
| Investment Strategy | |
| The Fund seeks to achieve a long-term capital appreciation and current income. The Fund typically invests 40% to 75% of its assets in equity securities selected primarily for their growth and 25% to 60% of its assets in equity and fixed income securities selected primarily for their income potential. |
| General | |
| Security Type | Mutual Fund |
| Equity Style | Multi Cap Value |
| Broad Asset Class | Allocation |
| Broad Category | Allocation |
| Global Peer Group | Mixed Asset USD Aggressive |
| Peer Group | Mixed-Asset Target Alloc Growth Funds |
| Global Macro | Mixed Asset HC Aggressive |
| US Macro | Mixed-Assets Target Allocation Funds |
| YCharts Categorization | -- |
| YCharts Benchmark | -- |
| Prospectus Objective | Growth & Income Funds |
| Fund Owner Firm Name | Lawson Kroeker |
| Broad Asset Class Benchmark Index | |
| ^SPXTR | 100.0% |
Net Fund Flows Versus Peer Group
1 Month
% Rank:
15
-859.80M
Peer Group Low
327.50M
Peer Group High
1 Year
% Rank:
17
-2.738M
-13.50B
Peer Group Low
3.669B
Peer Group High
3 Months
% Rank:
14
-5.251B
Peer Group Low
893.21M
Peer Group High
3 Years
% Rank:
19
-27.78B
Peer Group Low
5.767B
Peer Group High
6 Months
% Rank:
16
-9.264B
Peer Group Low
2.137B
Peer Group High
5 Years
% Rank:
20
-39.16B
Peer Group Low
5.767B
Peer Group High
YTD
% Rank:
15
-7.441B
Peer Group Low
1.845B
Peer Group High
10 Years
% Rank:
31
-59.83B
Peer Group Low
10.34B
Peer Group High
Date Unavailable
Risk
Performance Versus Peer Group
Annual Total Returns Versus Peers
As of June 10, 2026.
Asset Allocation
As of December 31, 2025.
| Type | % Net |
|---|---|
| Cash | 0.73% |
| Stock | 72.35% |
| Bond | 26.84% |
| Convertible | 0.00% |
| Preferred | 0.00% |
| Other | 0.08% |
Top 10 Holdings
| Name | % Weight | Price | % Change |
|---|---|---|---|
| Texas Pacific Land Corp. | 4.82% | 382.11 | -3.54% |
| Berkshire Hathaway, Inc. | 4.12% | 487.77 | 0.16% |
| Phillips 66 | 3.27% | 179.00 | -2.41% |
| Chevron Corp. | 3.23% | 186.76 | -1.31% |
| Johnson & Johnson | 2.86% | 237.00 | 2.08% |
| Microsoft Corp. | 2.82% | 403.41 | -2.02% |
| Alphabet, Inc. | 2.80% | 362.29 | 0.31% |
| Aflac, Inc. | 2.79% | 115.61 | 0.32% |
| The Hershey Co. | 2.68% | 175.84 | -0.03% |
| Cullen/Frost Bankers, Inc. | 2.68% | 143.69 | 2.02% |
Fees & Availability
| Fees | |
| Actual 12B-1 Fee | -- |
| Actual Management Fee | 0.27% |
| Administration Fee | 81.44K% |
| Maximum Front Load | -- |
| Maximum Deferred Load | -- |
| Maximum Redemption Fee | -- |
| General Availability | |
| Available for Insurance Product | No |
| Available for RRSP | No |
| Purchase Details | |
| Open to New Investors |
|
| Minimum Initial Investment | 50000.00 None |
| Minimum Subsequent Investment | 500.00 None |
Basic Info
| Investment Strategy | |
| The Fund seeks to achieve a long-term capital appreciation and current income. The Fund typically invests 40% to 75% of its assets in equity securities selected primarily for their growth and 25% to 60% of its assets in equity and fixed income securities selected primarily for their income potential. |
| General | |
| Security Type | Mutual Fund |
| Equity Style | Multi Cap Value |
| Broad Asset Class | Allocation |
| Broad Category | Allocation |
| Global Peer Group | Mixed Asset USD Aggressive |
| Peer Group | Mixed-Asset Target Alloc Growth Funds |
| Global Macro | Mixed Asset HC Aggressive |
| US Macro | Mixed-Assets Target Allocation Funds |
| YCharts Categorization | -- |
| YCharts Benchmark | -- |
| Prospectus Objective | Growth & Income Funds |
| Fund Owner Firm Name | Lawson Kroeker |
| Broad Asset Class Benchmark Index | |
| ^SPXTR | 100.0% |
Fundamentals
| General | |
| Distribution Yield | -- |
| Dividend Yield TTM (6-8-26) | 1.60% |
| 30-Day SEC Yield (4-30-26) | 1.55% |
| 7-Day SEC Yield | -- |
| Number of Holdings | 52 |
| Stock | |
| Weighted Average PE Ratio | 24.38 |
| Weighted Average Price to Sales Ratio | 5.573 |
| Weighted Average Price to Book Ratio | 4.265 |
| Weighted Median ROE | 646.7% |
| Weighted Median ROA | 8.38% |
| ROI (TTM) | 12.62% |
| Return on Investment (TTM) | 12.62% |
| Earning Yield | 0.0511 |
| LT Debt / Shareholders Equity | 3.920 |
| Number of Equity Holdings | 32 |
| Bond | |
| Yield to Maturity (12-31-25) | 4.08% |
| Effective Duration | -- |
| Average Coupon | 3.64% |
| Calculated Average Quality | 2.966 |
| Effective Maturity | 3.916 |
| Nominal Maturity | 3.946 |
| Number of Bond Holdings | 17 |
As of December 31, 2025
Growth Metrics
| EPS Growth (1Y) | 12.02% |
| EPS Growth (3Y) | 2.87% |
| EPS Growth (5Y) | 7.96% |
| Sales Growth (1Y) | 6.43% |
| Sales Growth (3Y) | 9.34% |
| Sales Growth (5Y) | 8.02% |
| Sales per Share Growth (1Y) | 7.43% |
| Sales per Share Growth (3Y) | 10.31% |
| Operating Cash Flow - Growth Rate (3Y) | 0.31% |
As of December 31, 2025
Fund Details
| Key Dates | |
| Inception Date | 6/29/2012 |
| Last Annual Report Date | 6/30/2025 |
| Last Prospectus Date | 10/28/2025 |
| Attributes | |
| Index Fund | -- |
| Inverse Fund | No |
| Leveraged Fund | -- |
| Fund of Funds | No |
| Currency Hedged Fund | -- |
| Socially Responsible Fund | No |
Top Portfolio Holders
| Name | % Weight |
|---|---|
| Portfolio A | 5.00% |
| Portfolio B | 3.50% |
| Portfolio C | 2.25% |
Excel Add-In Codes
| Name: =YCI("M:LKBLX", "name") |
| Broad Asset Class: =YCI("M:LKBLX", "broad_asset_class") |
| Broad Category: =YCI("M:LKBLX", "broad_category_group") |
| Prospectus Objective: =YCI("M:LKBLX", "prospectus_objective") |
| To find the codes for any of our securities and financial metrics, see our Complete Excel Reference. |