

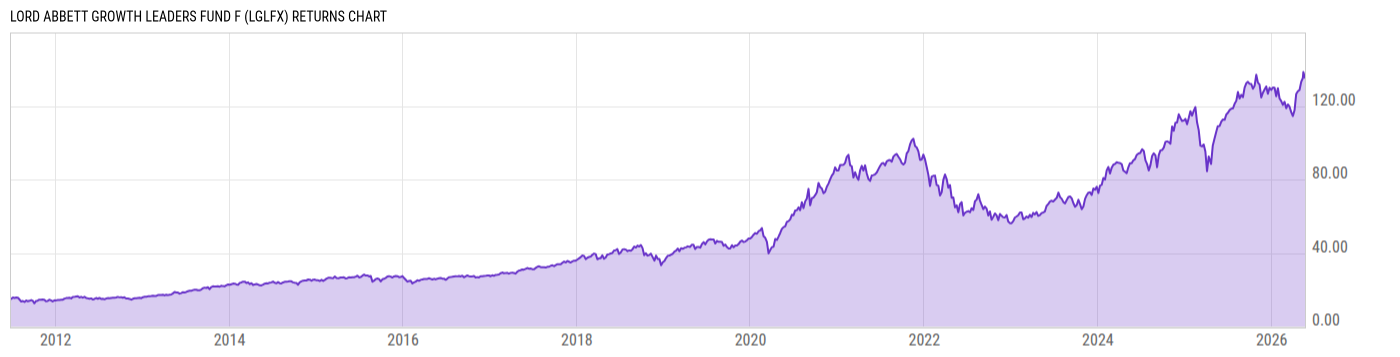
Lord Abbett Growth Leaders Fund F (LGLFX)
58.79
-0.40
(-0.68%)
USD |
Jun 09 2026
Returns Chart
Key Stats
| Net Expense Ratio | Total Assets Under Management | Weighted Average Dividend Yield | Turnover Ratio (Generic) |
|---|---|---|---|
| 0.64% | 7.673B | 0.27% | 72.00% |
| 1 Year Fund Level Flows | 1 Year Total Returns (Daily) | Annualized Total Returns Since Inception (Daily) | Max Drawdown (Since Inception) |
| -640.74M | 18.22% |
Basic Info
| Investment Strategy | |
| The Fund seeks capital appreciation. The Fund primarily invests in equity securities of U.S and foreign companies demonstrating above average, long term growth potential in all market capitalization ranges. |
| General | |
| Security Type | Mutual Fund |
| Equity Style | Large Cap Growth |
| Broad Asset Class | US Equity |
| Broad Category | Equity |
| Global Peer Group | Equity US |
| Peer Group | Multi-Cap Growth Funds |
| Global Macro | Equity North America |
| US Macro | Multi-Cap Funds |
| YCharts Categorization | -- |
| YCharts Benchmark | -- |
| Prospectus Objective | Growth Funds |
| Fund Owner Firm Name | Lord Abbett |
| Broad Asset Class Benchmark Index | |
| ^SPXTR | 100.0% |
Net Fund Flows Versus Peer Group
1 Month
% Rank:
69
-637.71M
Peer Group Low
3.845B
Peer Group High
1 Year
% Rank:
87
-640.74M
-11.53B
Peer Group Low
8.177B
Peer Group High
3 Months
% Rank:
76
-5.037B
Peer Group Low
5.947B
Peer Group High
3 Years
% Rank:
88
-24.08B
Peer Group Low
15.72B
Peer Group High
6 Months
% Rank:
89
-6.531B
Peer Group Low
6.742B
Peer Group High
5 Years
% Rank:
90
-30.68B
Peer Group Low
17.77B
Peer Group High
YTD
% Rank:
90
-5.479B
Peer Group Low
6.671B
Peer Group High
10 Years
% Rank:
75
-42.68B
Peer Group Low
17.77B
Peer Group High
Date Unavailable
Risk
Performance Versus Peer Group
Annual Total Returns Versus Peers
As of June 10, 2026.
Asset Allocation
As of March 31, 2026.
| Type | % Net |
|---|---|
| Cash | 2.61% |
| Stock | 97.39% |
| Bond | 0.00% |
| Convertible | 0.00% |
| Preferred | 0.00% |
| Other | 0.00% |
Top 10 Holdings
| Name | % Weight | Price | % Change |
|---|---|---|---|
| NVIDIA Corp. | 12.46% | 206.32 | -0.90% |
| Alphabet, Inc. | 6.82% | 365.32 | 0.29% |
| Apple, Inc. | 5.71% | 289.47 | -0.37% |
| Amazon.com, Inc. | 4.60% | 241.22 | -1.22% |
| Eli Lilly & Co. | 3.52% | 1156.71 | 1.05% |
| Comfort Systems USA, Inc. | 3.09% | 1821.94 | -0.53% |
| Broadcom Inc. | 2.94% | 377.61 | -3.71% |
| Cloudflare, Inc. | 2.62% | 226.63 | -4.02% |
|
Cash and Cash Equivalents
|
2.61% | -- | -- |
| Palantir Technologies, Inc. | 2.47% | 132.71 | 0.48% |
Fees & Availability
| Fees | |
| Actual 12B-1 Fee | 0.10% |
| Actual Management Fee | 0.41% |
| Administration Fee | 133.8K% |
| Maximum Front Load | -- |
| Maximum Deferred Load | -- |
| Maximum Redemption Fee | -- |
| General Availability | |
| Available for Insurance Product | No |
| Available for RRSP | No |
| Purchase Details | |
| Open to New Investors |
|
| Minimum Initial Investment | 0.00 None |
| Minimum Subsequent Investment | 0.00 None |
Basic Info
| Investment Strategy | |
| The Fund seeks capital appreciation. The Fund primarily invests in equity securities of U.S and foreign companies demonstrating above average, long term growth potential in all market capitalization ranges. |
| General | |
| Security Type | Mutual Fund |
| Equity Style | Large Cap Growth |
| Broad Asset Class | US Equity |
| Broad Category | Equity |
| Global Peer Group | Equity US |
| Peer Group | Multi-Cap Growth Funds |
| Global Macro | Equity North America |
| US Macro | Multi-Cap Funds |
| YCharts Categorization | -- |
| YCharts Benchmark | -- |
| Prospectus Objective | Growth Funds |
| Fund Owner Firm Name | Lord Abbett |
| Broad Asset Class Benchmark Index | |
| ^SPXTR | 100.0% |
Fundamentals
| General | |
| Distribution Yield | -- |
| Dividend Yield TTM (6-8-26) | 0.13% |
| 30-Day SEC Yield | -- |
| 7-Day SEC Yield | -- |
| Number of Holdings | 60 |
| Stock | |
| Weighted Average PE Ratio | 39.92 |
| Weighted Average Price to Sales Ratio | 12.64 |
| Weighted Average Price to Book Ratio | 16.36 |
| Weighted Median ROE | 44.49% |
| Weighted Median ROA | 20.82% |
| ROI (TTM) | 27.70% |
| Return on Investment (TTM) | 27.70% |
| Earning Yield | 0.0280 |
| LT Debt / Shareholders Equity | 0.5013 |
| Number of Equity Holdings | 59 |
As of March 31, 2026
Growth Metrics
| EPS Growth (1Y) | 40.69% |
| EPS Growth (3Y) | 39.86% |
| EPS Growth (5Y) | 40.98% |
| Sales Growth (1Y) | 30.45% |
| Sales Growth (3Y) | 29.86% |
| Sales Growth (5Y) | 27.09% |
| Sales per Share Growth (1Y) | 32.67% |
| Sales per Share Growth (3Y) | 28.82% |
| Operating Cash Flow - Growth Rate (3Y) | 57.17% |
As of March 31, 2026
Fund Details
| Key Dates | |
| Inception Date | 7/1/2011 |
| Last Annual Report Date | 10/31/2025 |
| Last Prospectus Date | 3/1/2026 |
| Share Classes | |
| LGLAX | A |
| LGLCX | C |
| LGLIX | Inst |
| LGLOX | F3 |
| LGLQX | Retirement |
| LGLRX | Retirement |
| LGLSX | Retirement |
| LGLUX | Retirement |
| LGLVX | Retirement |
| Attributes | |
| Index Fund | -- |
| Inverse Fund | No |
| Leveraged Fund | -- |
| Fund of Funds | No |
| Currency Hedged Fund | -- |
| Socially Responsible Fund | No |
Top Portfolio Holders
| Name | % Weight |
|---|---|
| Portfolio A | 5.00% |
| Portfolio B | 3.50% |
| Portfolio C | 2.25% |
Excel Add-In Codes
| Name: =YCI("M:LGLFX", "name") |
| Broad Asset Class: =YCI("M:LGLFX", "broad_asset_class") |
| Broad Category: =YCI("M:LGLFX", "broad_category_group") |
| Prospectus Objective: =YCI("M:LGLFX", "prospectus_objective") |
| To find the codes for any of our securities and financial metrics, see our Complete Excel Reference. |