

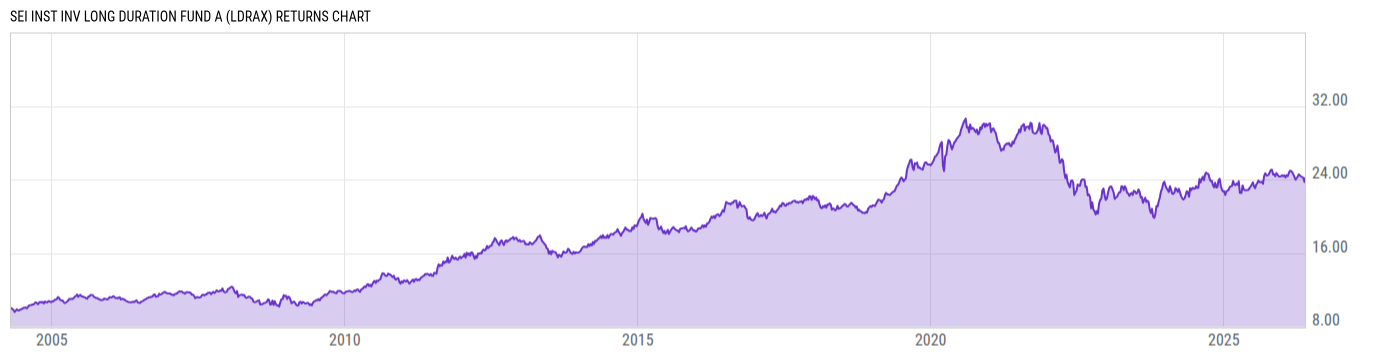
SEI Inst Inv Long Duration Fund A (LDRAX)
5.75
+0.02
(+0.35%)
USD |
Jun 09 2026
Returns Chart
Key Stats
| Net Expense Ratio | Total Assets Under Management | Weighted Average Dividend Yield | Turnover Ratio (Generic) |
|---|---|---|---|
| 0.39% | 762.77M | -- | 176.0% |
| 1 Year Fund Level Flows | 1 Year Total Returns (Daily) | Annualized Total Returns Since Inception (Daily) | Max Drawdown (Since Inception) |
| 257.73M | 5.73% |
Basic Info
| Investment Strategy | |
| The Fund seeks returns similar to those of high-quality corporate bonds, with a duration range of 10 - 13 years by investing in fixed income securities and synthetic instruments or derivatives having economic characteristics similar to fixed income securities rated in one of the three highest rating categories. |
| General | |
| Security Type | Mutual Fund |
| Equity Style | -- |
| Broad Asset Class | Taxable Bond |
| Broad Category | Fixed Income |
| Global Peer Group | Bond USD Corporates |
| Peer Group | Corporate Debt Funds BBB-Rated |
| Global Macro | Bond Corporates |
| US Macro | General Domestic Taxable Fixed Income Funds |
| YCharts Categorization | -- |
| YCharts Benchmark | -- |
| Prospectus Objective | Corporate Debt Funds BBB-Rated |
| Fund Owner Firm Name | SEI |
| Broad Asset Class Benchmark Index | |
| ^BBUSATR | 100.0% |
Net Fund Flows Versus Peer Group
1 Month
% Rank:
71
-1.441B
Peer Group Low
748.99M
Peer Group High
1 Year
% Rank:
15
257.73M
-3.244B
Peer Group Low
12.80B
Peer Group High
3 Months
% Rank:
58
-1.908B
Peer Group Low
1.681B
Peer Group High
3 Years
% Rank:
25
-9.856B
Peer Group Low
25.39B
Peer Group High
6 Months
% Rank:
16
-3.368B
Peer Group Low
8.887B
Peer Group High
5 Years
% Rank:
76
-10.18B
Peer Group Low
26.92B
Peer Group High
YTD
% Rank:
49
-471.58M
Peer Group Low
7.655B
Peer Group High
10 Years
% Rank:
97
-8.640B
Peer Group Low
62.93B
Peer Group High
Date Unavailable
Risk
Performance Versus Peer Group
Annual Total Returns Versus Peers
As of June 10, 2026.
Asset Allocation
As of April 30, 2026.
| Type | % Net |
|---|---|
| Cash | 0.48% |
| Stock | 0.00% |
| Bond | 98.69% |
| Convertible | 0.00% |
| Preferred | 0.00% |
| Other | 0.83% |
Top 10 Holdings
| Name | % Weight | Price | % Change |
|---|---|---|---|
|
2YR T-NOTE JUN26
|
9.26% | -- | -- |
| United States of America USGB 4.75 02/15/2056 FIX USD Government | 4.98% | 96.01 | 0.57% |
| United States of America USGB 4.125 02/15/2036 FIX USD Government | 2.89% | 96.91 | 0.30% |
|
10YR UL TN JUN26
|
2.77% | -- | -- |
| United States of America USGB 2.0 02/15/2050 FIX USD Government | 2.77% | 57.51 | 0.64% |
| United States of America USGB 4.875 08/15/2045 FIX USD Government | 1.85% | 98.25 | 0.51% |
|
US T BONDS JUN26
|
1.64% | -- | -- |
| United States of America USGB 4.625 02/15/2046 FIX USD Government | 1.50% | 94.99 | 0.52% |
| United States of America USGB 2.0 11/15/2041 FIX USD Government | 1.28% | 68.47 | 0.47% |
| United States of America USGB 4.625 11/15/2044 FIX USD Government | 1.10% | 95.40 | 0.50% |
Fees & Availability
| Fees | |
| Actual 12B-1 Fee | -- |
| Actual Management Fee | 0.30% |
| Administration Fee | -- |
| Maximum Front Load | -- |
| Maximum Deferred Load | -- |
| Maximum Redemption Fee | -- |
| General Availability | |
| Available for Insurance Product | No |
| Available for RRSP | No |
| Purchase Details | |
| Open to New Investors |
|
| Minimum Initial Investment | 100000.0 None |
| Minimum Subsequent Investment | 1000.00 None |
Basic Info
| Investment Strategy | |
| The Fund seeks returns similar to those of high-quality corporate bonds, with a duration range of 10 - 13 years by investing in fixed income securities and synthetic instruments or derivatives having economic characteristics similar to fixed income securities rated in one of the three highest rating categories. |
| General | |
| Security Type | Mutual Fund |
| Equity Style | -- |
| Broad Asset Class | Taxable Bond |
| Broad Category | Fixed Income |
| Global Peer Group | Bond USD Corporates |
| Peer Group | Corporate Debt Funds BBB-Rated |
| Global Macro | Bond Corporates |
| US Macro | General Domestic Taxable Fixed Income Funds |
| YCharts Categorization | -- |
| YCharts Benchmark | -- |
| Prospectus Objective | Corporate Debt Funds BBB-Rated |
| Fund Owner Firm Name | SEI |
| Broad Asset Class Benchmark Index | |
| ^BBUSATR | 100.0% |
Fundamentals
| General | |
| Distribution Yield | -- |
| Dividend Yield TTM (6-8-26) | 5.19% |
| 30-Day SEC Yield (5-31-26) | 5.47% |
| 7-Day SEC Yield | -- |
| Number of Holdings | 1033 |
| Bond | |
| Yield to Maturity (4-30-26) | 5.54% |
| Effective Duration | 12.56 |
| Average Coupon | 4.56% |
| Calculated Average Quality | 2.806 |
| Effective Maturity | 22.38 |
| Nominal Maturity | 22.50 |
| Number of Bond Holdings | 1012 |
As of April 30, 2026
Fund Details
| Key Dates | |
| Inception Date | 4/21/2004 |
| Last Annual Report Date | 5/31/2025 |
| Last Prospectus Date | 9/30/2025 |
| Attributes | |
| Index Fund | -- |
| Inverse Fund | No |
| Leveraged Fund | -- |
| Fund of Funds | No |
| Currency Hedged Fund | -- |
| Socially Responsible Fund | No |
Top Portfolio Holders
| Name | % Weight |
|---|---|
| Portfolio A | 5.00% |
| Portfolio B | 3.50% |
| Portfolio C | 2.25% |
Excel Add-In Codes
| Name: =YCI("M:LDRAX", "name") |
| Broad Asset Class: =YCI("M:LDRAX", "broad_asset_class") |
| Broad Category: =YCI("M:LDRAX", "broad_category_group") |
| Prospectus Objective: =YCI("M:LDRAX", "prospectus_objective") |
| To find the codes for any of our securities and financial metrics, see our Complete Excel Reference. |