

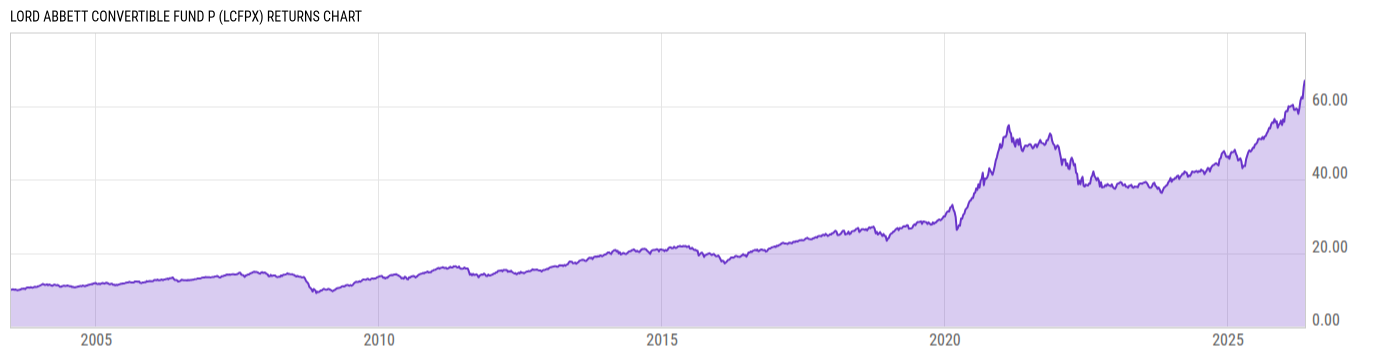
Lord Abbett Convertible Fund P (LCFPX)
20.78
+0.20
(+0.97%)
USD |
May 13 2026
Returns Chart
Key Stats
| Net Expense Ratio | Total Assets Under Management | Weighted Average Dividend Yield | Turnover Ratio (Generic) |
|---|---|---|---|
| 1.34% | 718.46M | -- | 151.0% |
| 1 Year Fund Level Flows | 1 Year Total Returns (Daily) | Annualized Total Returns Since Inception (Daily) | Max Drawdown (Since Inception) |
| -65.35M | 39.45% |
Basic Info
| Investment Strategy | |
| The Fund seeks current income and the opportunity for capital appreciation to produce a high total return. The Fund pursues its investment objective by investing at least 80% of its net assets, plus the amount of any borrowings, in a diversified portfolio of convertible securities issued by US and foreign companies. |
| General | |
| Security Type | Mutual Fund |
| Equity Style | -- |
| Broad Asset Class | Allocation |
| Broad Category | Fixed Income |
| Global Peer Group | Bond Convertibles US |
| Peer Group | Convertible Securities Funds |
| Global Macro | Bond Other |
| US Macro | Mixed-Assets Funds |
| YCharts Categorization | -- |
| YCharts Benchmark | -- |
| Prospectus Objective | Convertible Securities Funds |
| Fund Owner Firm Name | Lord Abbett |
| Broad Asset Class Benchmark Index | |
| ^SPXTR | 100.0% |
Net Fund Flows Versus Peer Group
1 Month
% Rank:
36
-85.57M
Peer Group Low
761.20M
Peer Group High
1 Year
% Rank:
64
-65.35M
-275.56M
Peer Group Low
2.558B
Peer Group High
3 Months
% Rank:
62
-125.80M
Peer Group Low
583.89M
Peer Group High
3 Years
% Rank:
60
-954.27M
Peer Group Low
3.432B
Peer Group High
6 Months
% Rank:
77
-221.08M
Peer Group Low
2.066B
Peer Group High
5 Years
% Rank:
75
-2.647B
Peer Group Low
3.059B
Peer Group High
YTD
% Rank:
85
-145.83M
Peer Group Low
1.400B
Peer Group High
10 Years
% Rank:
60
-2.618B
Peer Group Low
4.433B
Peer Group High
Date Unavailable
Risk
Performance Versus Peer Group
Annual Total Returns Versus Peers
As of May 14, 2026.
Asset Allocation
As of February 28, 2026.
| Type | % Net |
|---|---|
| Cash | 4.02% |
| Stock | 0.88% |
| Bond | 75.12% |
| Convertible | 2.34% |
| Preferred | 12.27% |
| Other | 5.37% |
Top 10 Holdings
| Name | % Weight | Price | % Change |
|---|---|---|---|
| Lumentum Holdings Inc. LUMEHOL 0.5 06/15/2028 FIX USD Corporate 144A | 4.41% | 783.81 | 3.91% |
| REDFIN CORPORATION REDFCOR 0.5 04/01/2027 FIX USD Corporate 144A | 4.21% | 96.16 | 0.24% |
| MGP Ingredients, Inc. MGPING 1.875 11/15/2041 FIX USD Corporate 144A | 4.19% | 84.87 | -0.35% |
|
Cash and Cash Equivalents
|
4.02% | -- | -- |
| SEA LIMITED SEALIM 0.25 09/15/2026 FIX USD Corporate | 3.85% | 98.51 | -0.30% |
| COINBASE GLOBAL, INC. COINGLO 0.5 06/01/2026 FIX USD Corporate | 3.80% | 99.82 | -0.02% |
| THE BOEING COMPANY BA 6.0 10/15/2027 FIX USD Corporate | 3.44% | 74.79 | -0.47% |
| Bank of America Corporation BACORP 7.25 12/31/2099 FIX USD Corporate | 3.42% | 1214.81 | 0.34% |
|
Borr Drilling Ltd 5% 08-FEB-2028
|
3.12% | -- | -- |
| AKAMAI TECHNOLOGIES, INC. AKAM 0.375 09/01/2027 FIX USD Corporate | 3.08% | 148.03 | 8.21% |
Fees & Availability
| Fees | |
| Actual 12B-1 Fee | 0.45% |
| Actual Management Fee | 0.70% |
| Administration Fee | 6.00% |
| Maximum Front Load | -- |
| Maximum Deferred Load | -- |
| Maximum Redemption Fee | -- |
| General Availability | |
| Available for Insurance Product | No |
| Available for RRSP | No |
| Purchase Details | |
| Open to New Investors | No |
| Minimum Initial Investment | 0.00 None |
| Minimum Subsequent Investment | 0.00 None |
Basic Info
| Investment Strategy | |
| The Fund seeks current income and the opportunity for capital appreciation to produce a high total return. The Fund pursues its investment objective by investing at least 80% of its net assets, plus the amount of any borrowings, in a diversified portfolio of convertible securities issued by US and foreign companies. |
| General | |
| Security Type | Mutual Fund |
| Equity Style | -- |
| Broad Asset Class | Allocation |
| Broad Category | Fixed Income |
| Global Peer Group | Bond Convertibles US |
| Peer Group | Convertible Securities Funds |
| Global Macro | Bond Other |
| US Macro | Mixed-Assets Funds |
| YCharts Categorization | -- |
| YCharts Benchmark | -- |
| Prospectus Objective | Convertible Securities Funds |
| Fund Owner Firm Name | Lord Abbett |
| Broad Asset Class Benchmark Index | |
| ^SPXTR | 100.0% |
Fundamentals
| General | |
| Distribution Yield | -- |
| Dividend Yield TTM (5-12-26) | 1.14% |
| 30-Day SEC Yield (4-30-26) | 0.40% |
| 7-Day SEC Yield | -- |
| Number of Holdings | 73 |
| Bond | |
| Yield to Maturity (2-28-26) | -2.45% |
| Effective Duration | 0.01 |
| Average Coupon | 2.08% |
| Calculated Average Quality | 3.838 |
| Effective Maturity | 3.811 |
| Nominal Maturity | 3.811 |
| Number of Bond Holdings | 54 |
As of February 28, 2026
Fund Details
| Key Dates | |
| Inception Date | 6/30/2003 |
| Last Annual Report Date | 11/30/2025 |
| Last Prospectus Date | 4/1/2025 |
| Share Classes | |
| LACCX | C |
| LACFX | A |
| LBCQX | Retirement |
| LBFFX | F |
| LCFRX | Retirement |
| LCFSX | Retirement |
| LCFTX | Retirement |
| LCFVX | Retirement |
| LCFYX | Inst |
| LOCFX | F3 |
| Attributes | |
| Index Fund | -- |
| Inverse Fund | No |
| Leveraged Fund | -- |
| Fund of Funds | No |
| Currency Hedged Fund | -- |
| Socially Responsible Fund | No |
Top Portfolio Holders
| Name | % Weight |
|---|---|
| Portfolio A | 5.00% |
| Portfolio B | 3.50% |
| Portfolio C | 2.25% |
Excel Add-In Codes
| Name: =YCI("M:LCFPX", "name") |
| Broad Asset Class: =YCI("M:LCFPX", "broad_asset_class") |
| Broad Category: =YCI("M:LCFPX", "broad_category_group") |
| Prospectus Objective: =YCI("M:LCFPX", "prospectus_objective") |
| To find the codes for any of our securities and financial metrics, see our Complete Excel Reference. |