

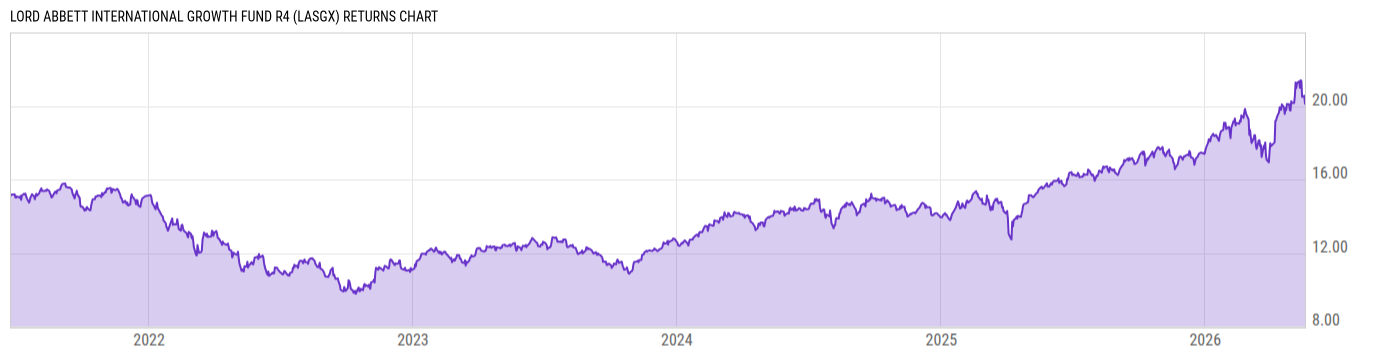
Lord Abbett International Growth Fund R4 (LASGX)
20.80
+0.08
(+0.39%)
USD |
Jun 09 2026
Returns Chart
Key Stats
| Net Expense Ratio | Total Assets Under Management | Weighted Average Dividend Yield | Turnover Ratio (Generic) |
|---|---|---|---|
| 0.95% | 5.932M | 1.37% | 125.0% |
| 1 Year Fund Level Flows | 1 Year Total Returns (Daily) | Annualized Total Returns Since Inception (Daily) | Max Drawdown (Since Inception) |
| 1.075M | 32.59% |
Basic Info
| Investment Strategy | |
| The Fund seeks long-term capital appreciation. The Fund invests in a diversified portfolio of equity securities of large foreign companies included in the largest 80% in terms of market capitalization at the time of investment in MSCI ACWI ex USA Index that demonstrate above-average, long-term growth potential. |
| General | |
| Security Type | Mutual Fund |
| Equity Style | Large Cap Growth |
| Broad Asset Class | International Equity |
| Broad Category | Equity |
| Global Peer Group | Equity Global ex US |
| Peer Group | International Large-Cap Growth |
| Global Macro | Equity Global |
| US Macro | Developed International Markets Funds |
| YCharts Categorization | -- |
| YCharts Benchmark | -- |
| Prospectus Objective | International Funds |
| Fund Owner Firm Name | Lord Abbett |
| Broad Asset Class Benchmark Index | |
| ^MSACXUSNTR | 100.0% |
Net Fund Flows Versus Peer Group
1 Month
% Rank:
26
-1.327B
Peer Group Low
381.70M
Peer Group High
1 Year
% Rank:
29
1.075M
-23.18B
Peer Group Low
2.310B
Peer Group High
3 Months
% Rank:
22
-3.007B
Peer Group Low
5.340B
Peer Group High
3 Years
% Rank:
36
-55.54B
Peer Group Low
3.519B
Peer Group High
6 Months
% Rank:
26
-10.04B
Peer Group Low
5.146B
Peer Group High
5 Years
% Rank:
36
-80.31B
Peer Group Low
6.055B
Peer Group High
YTD
% Rank:
25
-6.456B
Peer Group Low
5.340B
Peer Group High
10 Years
% Rank:
44
-106.84B
Peer Group Low
8.602B
Peer Group High
Date Unavailable
Risk
Performance Versus Peer Group
Annual Total Returns Versus Peers
As of June 10, 2026.
Asset Allocation
As of March 31, 2026.
| Type | % Net |
|---|---|
| Cash | 11.34% |
| Stock | 88.66% |
| Bond | 0.00% |
| Convertible | 0.00% |
| Preferred | 0.00% |
| Other | 0.00% |
Top 10 Holdings
| Name | % Weight | Price | % Change |
|---|---|---|---|
|
Cash and Cash Equivalents
|
11.34% | -- | -- |
| Taiwan Semiconductor Manufacturing Co., Ltd. | 6.60% | 17.24 | 0.00% |
| ASML Holding NV | 4.06% | 1683.72 | -3.25% |
|
SK Hynix Inc ORD
|
2.97% | -- | -- |
| Tencent Holdings Ltd. | 2.58% | 57.46 | 0.98% |
| Siemens Energy AG | 2.28% | 180.50 | 0.65% |
| Samsung Electronics Co., Ltd. | 2.25% | 140.00 | 0.00% |
| AstraZeneca PLC | 2.10% | 183.43 | 1.04% |
| Novartis AG | 1.98% | 144.88 | 0.00% |
| Hitachi Ltd. | 1.80% | 30.05 | -9.06% |
Fees & Availability
| Fees | |
| Actual 12B-1 Fee | 0.25% |
| Actual Management Fee | -- |
| Administration Fee | 4.00% |
| Maximum Front Load | -- |
| Maximum Deferred Load | -- |
| Maximum Redemption Fee | -- |
| General Availability | |
| Available for Insurance Product | No |
| Available for RRSP | No |
| Purchase Details | |
| Open to New Investors |
|
| Minimum Initial Investment | 0.00 None |
| Minimum Subsequent Investment | 0.00 None |
Basic Info
| Investment Strategy | |
| The Fund seeks long-term capital appreciation. The Fund invests in a diversified portfolio of equity securities of large foreign companies included in the largest 80% in terms of market capitalization at the time of investment in MSCI ACWI ex USA Index that demonstrate above-average, long-term growth potential. |
| General | |
| Security Type | Mutual Fund |
| Equity Style | Large Cap Growth |
| Broad Asset Class | International Equity |
| Broad Category | Equity |
| Global Peer Group | Equity Global ex US |
| Peer Group | International Large-Cap Growth |
| Global Macro | Equity Global |
| US Macro | Developed International Markets Funds |
| YCharts Categorization | -- |
| YCharts Benchmark | -- |
| Prospectus Objective | International Funds |
| Fund Owner Firm Name | Lord Abbett |
| Broad Asset Class Benchmark Index | |
| ^MSACXUSNTR | 100.0% |
Fundamentals
| General | |
| Distribution Yield | -- |
| Dividend Yield TTM (6-8-26) | 0.12% |
| 30-Day SEC Yield | -- |
| 7-Day SEC Yield | -- |
| Number of Holdings | 77 |
| Stock | |
| Weighted Average PE Ratio | 33.06 |
| Weighted Average Price to Sales Ratio | 5.623 |
| Weighted Average Price to Book Ratio | 6.892 |
| Weighted Median ROE | 23.46% |
| Weighted Median ROA | 11.15% |
| ROI (TTM) | 17.72% |
| Return on Investment (TTM) | 17.72% |
| Earning Yield | 0.0417 |
| LT Debt / Shareholders Equity | 0.4002 |
| Number of Equity Holdings | 76 |
As of March 31, 2026
Growth Metrics
| EPS Growth (1Y) | 35.16% |
| EPS Growth (3Y) | 23.57% |
| EPS Growth (5Y) | 30.50% |
| Sales Growth (1Y) | 19.22% |
| Sales Growth (3Y) | 12.99% |
| Sales Growth (5Y) | 16.43% |
| Sales per Share Growth (1Y) | 20.29% |
| Sales per Share Growth (3Y) | 13.13% |
| Operating Cash Flow - Growth Rate (3Y) | 24.72% |
As of March 31, 2026
Fund Details
| Key Dates | |
| Inception Date | 6/24/2021 |
| Last Annual Report Date | 7/31/2025 |
| Last Prospectus Date | 12/1/2025 |
| Share Classes | |
| LAAGX | A |
| LAFGX | F |
| LAVGX | Retirement |
| LCAGX | C |
| LIAGX | Inst |
| LOAGX | F3 |
| LRAGX | Retirement |
| LTAGX | Retirement |
| Attributes | |
| Index Fund | -- |
| Inverse Fund | No |
| Leveraged Fund | -- |
| Fund of Funds | No |
| Currency Hedged Fund | -- |
| Socially Responsible Fund | No |
Top Portfolio Holders
| Name | % Weight |
|---|---|
| Portfolio A | 5.00% |
| Portfolio B | 3.50% |
| Portfolio C | 2.25% |
Excel Add-In Codes
| Name: =YCI("M:LASGX", "name") |
| Broad Asset Class: =YCI("M:LASGX", "broad_asset_class") |
| Broad Category: =YCI("M:LASGX", "broad_category_group") |
| Prospectus Objective: =YCI("M:LASGX", "prospectus_objective") |
| To find the codes for any of our securities and financial metrics, see our Complete Excel Reference. |