

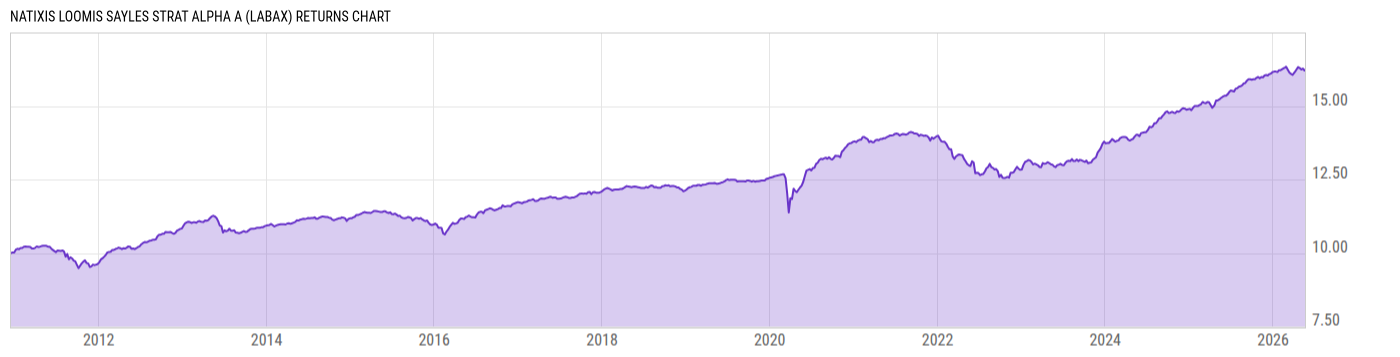
Natixis Loomis Sayles Strat Alpha A (LABAX)
9.86
+0.01
(+0.10%)
USD |
Jun 09 2026
Returns Chart
Key Stats
| Net Expense Ratio | Total Assets Under Management | Weighted Average Dividend Yield | Turnover Ratio (Generic) |
|---|---|---|---|
| 0.98% | 1.160B | -- | 57.00% |
| 1 Year Fund Level Flows | 1 Year Total Returns (Daily) | Annualized Total Returns Since Inception (Daily) | Max Drawdown (Since Inception) |
| 274.71M | 6.02% |
Basic Info
| Investment Strategy | |
| The Fund seeks to provide an attractive absolute total return. The Fund will pursue its investment goal by obtaining long investment exposures through direct cash investments and derivatives and short investment exposures substantially through derivatives. |
| General | |
| Security Type | Mutual Fund |
| Equity Style | -- |
| Broad Asset Class | Alternative |
| Broad Category | Alternative Strategies |
| Global Peer Group | Absolute Return USD Low |
| Peer Group | Absolute Return Funds |
| Global Macro | Absolute Return |
| US Macro | Alternative Equity Funds |
| YCharts Categorization | -- |
| YCharts Benchmark | -- |
| Prospectus Objective | Absolute Return Funds |
| Fund Owner Firm Name | Loomis Sayles |
| Broad Asset Class Benchmark Index | |
| ^MSACWINTR | 100.0% |
Net Fund Flows Versus Peer Group
1 Month
% Rank:
17
-68.03M
Peer Group Low
52.92M
Peer Group High
1 Year
% Rank:
15
274.71M
-169.48M
Peer Group Low
717.90M
Peer Group High
3 Months
% Rank:
19
-77.17M
Peer Group Low
300.39M
Peer Group High
3 Years
% Rank:
19
-1.988B
Peer Group Low
1.412B
Peer Group High
6 Months
% Rank:
18
-73.27M
Peer Group Low
418.42M
Peer Group High
5 Years
% Rank:
89
-2.626B
Peer Group Low
1.282B
Peer Group High
YTD
% Rank:
19
-57.70M
Peer Group Low
385.57M
Peer Group High
10 Years
% Rank:
80
-8.918B
Peer Group Low
3.228B
Peer Group High
Date Unavailable
Risk
Performance Versus Peer Group
Annual Total Returns Versus Peers
As of June 10, 2026.
Asset Allocation
As of January 31, 2026.
| Type | % Net |
|---|---|
| Cash | 8.71% |
| Stock | 0.86% |
| Bond | 87.85% |
| Convertible | 0.00% |
| Preferred | 0.00% |
| Other | 2.58% |
Top 10 Holdings
| Name | % Weight | Price | % Change |
|---|---|---|---|
|
USD CASH
|
4.49% | -- | -- |
| United States of America USGB 02/28/2026 FIX USD Government (Matured) | 4.45% | 100.00 | 0.02% |
| United States of America USGB 0.625 05/15/2030 FIX USD Government | 4.11% | 87.07 | 0.15% |
| United States of America USGB 04/15/2026 FIX USD Government (Matured) | 3.54% | 100.00 | 0.00% |
|
FIXED INCOME CLEARING CORP REPO
|
3.43% | -- | -- |
| United States of America USGB 03/31/2026 FIX USD Government (Matured) | 3.03% | 100.00 | -0.02% |
| United States of America USGB 05/31/2026 FIX USD Government (Matured) | 1.88% | 100.00 | -0.00% |
|
SOUTH AFRICA, REPUBLIC OF (GOVERNMENT) 8.5% 31-JAN-2037
|
1.43% | -- | -- |
| EchoStar Corporation ECHO 10.75 11/30/2029 FIX USD Corporate | 1.40% | 108.42 | -0.05% |
|
SOUTH AFRICA, REPUBLIC OF (GOVERNMENT) 9% 31-JAN-2040
|
0.86% | -- | -- |
Fees & Availability
| Fees | |
| Actual 12B-1 Fee | 0.25% |
| Actual Management Fee | 0.55% |
| Administration Fee | 7.10K% |
| Maximum Front Load | 4.25% |
| Maximum Deferred Load | -- |
| Maximum Redemption Fee | -- |
| General Availability | |
| Available for Insurance Product | No |
| Available for RRSP | No |
| Purchase Details | |
| Open to New Investors |
|
| Minimum Initial Investment | 2500.00 None |
| Minimum Subsequent Investment | 50.00 None |
Basic Info
| Investment Strategy | |
| The Fund seeks to provide an attractive absolute total return. The Fund will pursue its investment goal by obtaining long investment exposures through direct cash investments and derivatives and short investment exposures substantially through derivatives. |
| General | |
| Security Type | Mutual Fund |
| Equity Style | -- |
| Broad Asset Class | Alternative |
| Broad Category | Alternative Strategies |
| Global Peer Group | Absolute Return USD Low |
| Peer Group | Absolute Return Funds |
| Global Macro | Absolute Return |
| US Macro | Alternative Equity Funds |
| YCharts Categorization | -- |
| YCharts Benchmark | -- |
| Prospectus Objective | Absolute Return Funds |
| Fund Owner Firm Name | Loomis Sayles |
| Broad Asset Class Benchmark Index | |
| ^MSACWINTR | 100.0% |
Fundamentals
| General | |
| Distribution Yield | -- |
| Dividend Yield TTM (6-8-26) | 4.63% |
| 30-Day SEC Yield (4-30-26) | 4.55% |
| 7-Day SEC Yield (7-31-22) | 4.30% |
| Number of Holdings | 889 |
| Bond | |
| Yield to Maturity (1-31-26) | 5.04% |
| Effective Duration | 2.86 |
| Average Coupon | 5.37% |
| Calculated Average Quality | 3.578 |
| Effective Maturity | 8.702 |
| Nominal Maturity | 8.918 |
| Number of Bond Holdings | 758 |
As of January 31, 2026
Fund Details
Top Portfolio Holders
| Name | % Weight |
|---|---|
| Portfolio A | 5.00% |
| Portfolio B | 3.50% |
| Portfolio C | 2.25% |
Excel Add-In Codes
| Name: =YCI("M:LABAX", "name") |
| Broad Asset Class: =YCI("M:LABAX", "broad_asset_class") |
| Broad Category: =YCI("M:LABAX", "broad_category_group") |
| Prospectus Objective: =YCI("M:LABAX", "prospectus_objective") |
| To find the codes for any of our securities and financial metrics, see our Complete Excel Reference. |