

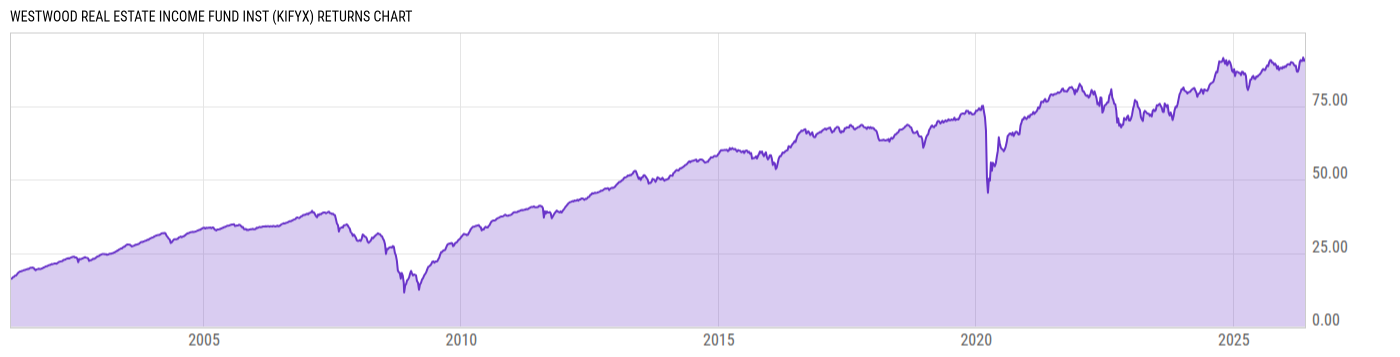
Westwood Real Estate Income Fund Inst (KIFYX)
17.57
0.00 (0.00%)
USD |
May 21 2026
Returns Chart
Key Stats
| Net Expense Ratio | Total Assets Under Management | Weighted Average Dividend Yield | Turnover Ratio (Generic) |
|---|---|---|---|
| 0.85% | 242.90M | -- | 67.00% |
| 1 Year Fund Level Flows | 1 Year Total Returns (Daily) | Annualized Total Returns Since Inception (Daily) | Max Drawdown (Since Inception) |
| -27.77M | 8.01% |
Basic Info
| Investment Strategy | |
| The Fund seeks high current income and potential for modest long term growth of capital. Under normal conditions, the Fund invests at least 80% of its net assets in income-producing securities of companies in the real estate industry. The Fund invests primarily in REITs, master limited partnerships and other real estate. |
| General | |
| Security Type | Mutual Fund |
| Equity Style | -- |
| Broad Asset Class | Sector Equity |
| Broad Category | Equity |
| Global Peer Group | Equity Sector Real Estate US |
| Peer Group | Real Estate Funds |
| Global Macro | Equity Real Estate |
| US Macro | Sector Equity Funds |
| YCharts Categorization | -- |
| YCharts Benchmark | -- |
| Prospectus Objective | Real Estate Funds |
| Fund Owner Firm Name | Westwood |
| Broad Asset Class Benchmark Index | |
| ^MSWNTR | 100.0% |
Net Fund Flows Versus Peer Group
1 Month
% Rank:
47
-1.958B
Peer Group Low
250.50M
Peer Group High
1 Year
% Rank:
54
-27.77M
-1.347B
Peer Group Low
929.48M
Peer Group High
3 Months
% Rank:
53
-1.898B
Peer Group Low
306.86M
Peer Group High
3 Years
% Rank:
41
-6.202B
Peer Group Low
2.527B
Peer Group High
6 Months
% Rank:
60
-1.720B
Peer Group Low
599.29M
Peer Group High
5 Years
% Rank:
54
-5.705B
Peer Group Low
3.751B
Peer Group High
YTD
% Rank:
54
-1.797B
Peer Group Low
318.65M
Peer Group High
10 Years
% Rank:
73
-7.424B
Peer Group Low
6.609B
Peer Group High
Date Unavailable
Risk
Performance Versus Peer Group
Annual Total Returns Versus Peers
As of May 22, 2026.
Asset Allocation
As of March 31, 2026.
| Type | % Net |
|---|---|
| Cash | 0.74% |
| Stock | 35.78% |
| Bond | 0.61% |
| Convertible | 0.00% |
| Preferred | 62.25% |
| Other | 0.63% |
Top 10 Holdings
| Name | % Weight | Price | % Change |
|---|---|---|---|
|
HOVNAN 1000 DS REP 1 SRS A PRF
|
4.43% | -- | -- |
| KKR Real Estate Finance Trust Inc. KKRREA 6.5 12/31/2099 FIX USD Corporate | 3.89% | 17.99 | -0.63% |
| RLJ LODGING TRUST, L.P. RLJLOD 7.8 12/31/2099 FIX USD Corporate | 3.87% | 25.18 | -0.07% |
| COPT Defense Properties | 3.85% | 32.31 | 1.48% |
| CTO Realty Growth, Inc. CTOREA 6.375 12/31/2099 FIX USD Corporate | 3.84% | -- | 0.37% |
| Crown Castle, Inc. | 3.64% | 92.04 | -0.65% |
| Pebblebrook Hotel Trust PEBBHOT 5.7 12/31/2099 FIX USD Corporate | 3.59% | 17.58 | -0.41% |
| LXP Industrial Trust LXPIND 6.5 12/31/2099 FIX USD Corporate | 3.55% | 46.44 | -0.24% |
| National Storage Affiliates Trust NATISTO 6.0 12/31/2099 FIX USD Corporate | 3.50% | 22.91 | 0.17% |
|
SAUL CTRS 1/100 CUM DS REP SRS D PRF
|
3.17% | -- | -- |
Fees & Availability
| Fees | |
| Actual 12B-1 Fee | -- |
| Actual Management Fee | 0.70% |
| Administration Fee | 54.27K% |
| Maximum Front Load | -- |
| Maximum Deferred Load | -- |
| Maximum Redemption Fee | 0.00% |
| General Availability | |
| Available for Insurance Product | No |
| Available for RRSP | No |
| Purchase Details | |
| Open to New Investors |
|
| Minimum Initial Investment | 100000.0 None |
| Minimum Subsequent Investment | 0.00 None |
Basic Info
| Investment Strategy | |
| The Fund seeks high current income and potential for modest long term growth of capital. Under normal conditions, the Fund invests at least 80% of its net assets in income-producing securities of companies in the real estate industry. The Fund invests primarily in REITs, master limited partnerships and other real estate. |
| General | |
| Security Type | Mutual Fund |
| Equity Style | -- |
| Broad Asset Class | Sector Equity |
| Broad Category | Equity |
| Global Peer Group | Equity Sector Real Estate US |
| Peer Group | Real Estate Funds |
| Global Macro | Equity Real Estate |
| US Macro | Sector Equity Funds |
| YCharts Categorization | -- |
| YCharts Benchmark | -- |
| Prospectus Objective | Real Estate Funds |
| Fund Owner Firm Name | Westwood |
| Broad Asset Class Benchmark Index | |
| ^MSWNTR | 100.0% |
Fundamentals
| General | |
| Distribution Yield | -- |
| Dividend Yield TTM (5-20-26) | 7.73% |
| 30-Day SEC Yield (4-30-26) | 5.77% |
| 7-Day SEC Yield | -- |
| Number of Holdings | 10 |
Fund Details
| Key Dates | |
| Inception Date | 4/28/2006 |
| Last Annual Report Date | 10/31/2025 |
| Last Prospectus Date | 2/28/2026 |
| Share Classes | |
| KIFAX | A |
| Attributes | |
| Index Fund | -- |
| Inverse Fund | No |
| Leveraged Fund | -- |
| Fund of Funds | No |
| Currency Hedged Fund | -- |
| Socially Responsible Fund | No |
Top Portfolio Holders
| Name | % Weight |
|---|---|
| Portfolio A | 5.00% |
| Portfolio B | 3.50% |
| Portfolio C | 2.25% |
Excel Add-In Codes
| Name: =YCI("M:KIFYX", "name") |
| Broad Asset Class: =YCI("M:KIFYX", "broad_asset_class") |
| Broad Category: =YCI("M:KIFYX", "broad_category_group") |
| Prospectus Objective: =YCI("M:KIFYX", "prospectus_objective") |
| To find the codes for any of our securities and financial metrics, see our Complete Excel Reference. |