

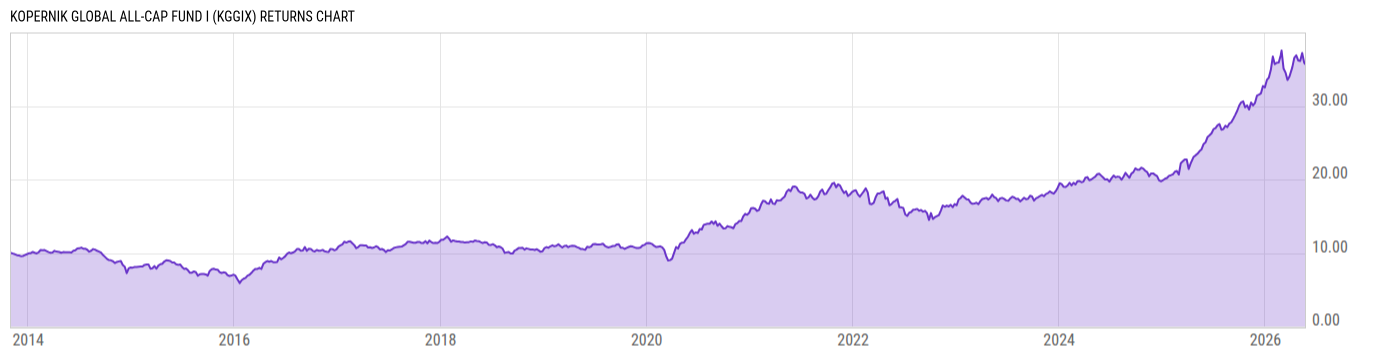
Kopernik Global All-Cap Fund I (KGGIX)
16.31
-0.05
(-0.31%)
USD |
Jun 09 2026
Returns Chart
Key Stats
| Net Expense Ratio | Total Assets Under Management | Weighted Average Dividend Yield | Turnover Ratio (Generic) |
|---|---|---|---|
| 1.01% | 3.244B | 2.31% | 56.00% |
| 1 Year Fund Level Flows | 1 Year Total Returns (Daily) | Annualized Total Returns Since Inception (Daily) | Max Drawdown (Since Inception) |
| -87.16M | 31.47% |
Basic Info
| Investment Strategy | |
| The Fund seeks long-term capital appreciation. The Fund plans to invest 80% of its net assets, plus the amount of borrowings for investment purposes, in equity securities of US and non-US companies of any size. It will invest 40% of its net assets to issuers outside the US and up to 35% to issuers in emerging markets. |
| General | |
| Security Type | Mutual Fund |
| Equity Style | Multi Cap Value |
| Broad Asset Class | International Equity |
| Broad Category | Equity |
| Global Peer Group | Equity Global Sm&Mid Cap |
| Peer Group | Global Small-/Mid-Cap Funds |
| Global Macro | Equity Global |
| US Macro | Developed Global Markets Funds |
| YCharts Categorization | -- |
| YCharts Benchmark | -- |
| Prospectus Objective | Global Small-Cap Funds |
| Fund Owner Firm Name | Kopernik Global Investors |
| Broad Asset Class Benchmark Index | |
| ^MSACXUSNTR | 100.0% |
Net Fund Flows Versus Peer Group
1 Month
% Rank:
16
-661.36M
Peer Group Low
262.67M
Peer Group High
1 Year
% Rank:
71
-87.16M
-2.427B
Peer Group Low
378.09M
Peer Group High
3 Months
% Rank:
2
-798.34M
Peer Group Low
21.79M
Peer Group High
3 Years
% Rank:
76
-2.641B
Peer Group Low
462.91M
Peer Group High
6 Months
% Rank:
76
-2.398B
Peer Group Low
154.18M
Peer Group High
5 Years
% Rank:
85
-12.29B
Peer Group Low
2.259B
Peer Group High
YTD
% Rank:
2
-1.536B
Peer Group Low
78.30M
Peer Group High
10 Years
% Rank:
18
-13.28B
Peer Group Low
14.48B
Peer Group High
Date Unavailable
Risk
Performance Versus Peer Group
Annual Total Returns Versus Peers
As of June 10, 2026.
Asset Allocation
As of April 30, 2026.
| Type | % Net |
|---|---|
| Cash | 15.07% |
| Stock | 79.90% |
| Bond | 1.89% |
| Convertible | 0.00% |
| Preferred | 1.39% |
| Other | 1.75% |
Top 10 Holdings
| Name | % Weight | Price | % Change |
|---|---|---|---|
|
Brown Brothers Harriman & Co
|
15.01% | -- | -- |
| Valterra Platinum Ltd. | 3.41% | 71.30 | 0.00% |
|
LG Uplus Corp ORD
|
2.90% | -- | -- |
| Seabridge Gold, Inc. | 2.88% | 26.90 | -3.24% |
| Range Resources Corp. | 2.55% | 38.96 | 1.33% |
| K+S AG | 2.45% | 16.80 | 0.00% |
| Golden Agri-Resources Ltd. | 2.02% | 0.2146 | 0.00% |
|
LG Corp ORD
|
1.81% | -- | -- |
| Impala Platinum Holdings Ltd. | 1.76% | 13.15 | 0.00% |
| CK Hutchison Holdings Ltd. | 1.65% | 8.792 | 0.00% |
Fees & Availability
| Fees | |
| Actual 12B-1 Fee | -- |
| Actual Management Fee | 0.90% |
| Administration Fee | 1.60M% |
| Maximum Front Load | -- |
| Maximum Deferred Load | -- |
| Maximum Redemption Fee | -- |
| General Availability | |
| Available for Insurance Product | No |
| Available for RRSP | No |
| Purchase Details | |
| Open to New Investors | No |
| Minimum Initial Investment | 1.00M None |
| Minimum Subsequent Investment | 0.00 None |
Basic Info
| Investment Strategy | |
| The Fund seeks long-term capital appreciation. The Fund plans to invest 80% of its net assets, plus the amount of borrowings for investment purposes, in equity securities of US and non-US companies of any size. It will invest 40% of its net assets to issuers outside the US and up to 35% to issuers in emerging markets. |
| General | |
| Security Type | Mutual Fund |
| Equity Style | Multi Cap Value |
| Broad Asset Class | International Equity |
| Broad Category | Equity |
| Global Peer Group | Equity Global Sm&Mid Cap |
| Peer Group | Global Small-/Mid-Cap Funds |
| Global Macro | Equity Global |
| US Macro | Developed Global Markets Funds |
| YCharts Categorization | -- |
| YCharts Benchmark | -- |
| Prospectus Objective | Global Small-Cap Funds |
| Fund Owner Firm Name | Kopernik Global Investors |
| Broad Asset Class Benchmark Index | |
| ^MSACXUSNTR | 100.0% |
Fundamentals
| General | |
| Distribution Yield | -- |
| Dividend Yield TTM (6-8-26) | 5.91% |
| 30-Day SEC Yield (5-31-26) | 11.75% |
| 7-Day SEC Yield | -- |
| Number of Holdings | 162 |
| Stock | |
| Weighted Average PE Ratio | 17.16 |
| Weighted Average Price to Sales Ratio | 2.354 |
| Weighted Average Price to Book Ratio | 1.891 |
| Weighted Median ROE | 5.51% |
| Weighted Median ROA | 2.14% |
| ROI (TTM) | 2.68% |
| Return on Investment (TTM) | 2.68% |
| Earning Yield | 7.959 |
| LT Debt / Shareholders Equity | 0.5377 |
| Number of Equity Holdings | 137 |
As of April 30, 2026
Growth Metrics
| EPS Growth (1Y) | 16.04% |
| EPS Growth (3Y) | -8.37% |
| EPS Growth (5Y) | 9.50% |
| Sales Growth (1Y) | 9.24% |
| Sales Growth (3Y) | 4.38% |
| Sales Growth (5Y) | 9.19% |
| Sales per Share Growth (1Y) | 9.13% |
| Sales per Share Growth (3Y) | 9.74% |
| Operating Cash Flow - Growth Rate (3Y) | -1.21% |
As of April 30, 2026
Fund Details
| Key Dates | |
| Inception Date | 11/1/2013 |
| Last Annual Report Date | 10/31/2025 |
| Last Prospectus Date | 3/1/2026 |
| Share Classes | |
| KGGAX | A |
| Attributes | |
| Index Fund | -- |
| Inverse Fund | No |
| Leveraged Fund | -- |
| Fund of Funds | No |
| Currency Hedged Fund | -- |
| Socially Responsible Fund | No |
Top Portfolio Holders
| Name | % Weight |
|---|---|
| Portfolio A | 5.00% |
| Portfolio B | 3.50% |
| Portfolio C | 2.25% |
Excel Add-In Codes
| Name: =YCI("M:KGGIX", "name") |
| Broad Asset Class: =YCI("M:KGGIX", "broad_asset_class") |
| Broad Category: =YCI("M:KGGIX", "broad_category_group") |
| Prospectus Objective: =YCI("M:KGGIX", "prospectus_objective") |
| To find the codes for any of our securities and financial metrics, see our Complete Excel Reference. |