

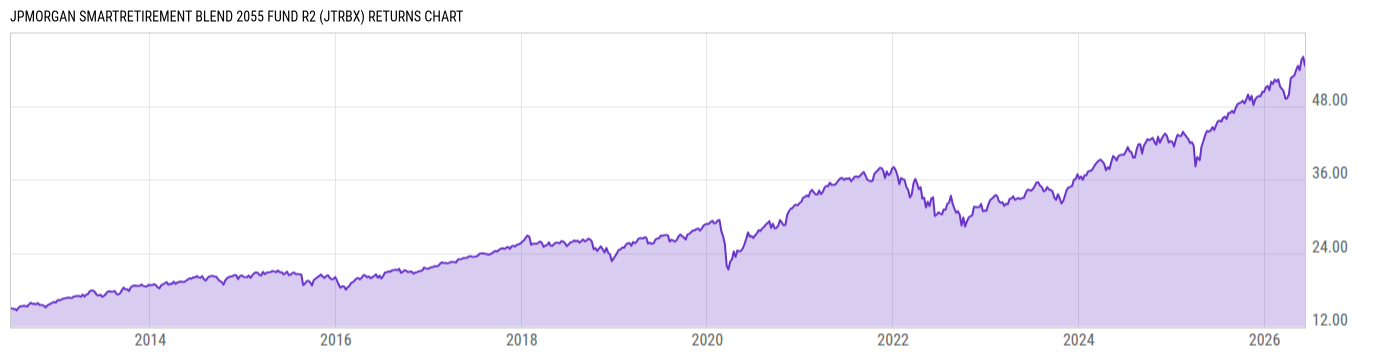
JPMorgan SmartRetirement Blend 2055 Fund R2 (JTRBX)
41.92
+0.01
(+0.02%)
USD |
Jun 09 2026
Returns Chart
Key Stats
| Net Expense Ratio | Total Assets Under Management | Weighted Average Dividend Yield | Turnover Ratio (Generic) |
|---|---|---|---|
| 0.92% | 1.684B | -- | 22.00% |
| 1 Year Fund Level Flows | 1 Year Total Returns (Daily) | Annualized Total Returns Since Inception (Daily) | Max Drawdown (Since Inception) |
| 140.15M | 22.90% |
Basic Info
| Investment Strategy | |
| The Fund seeks high total return with a shift to current income and some capital appreciation over time as it approaches and passes the target retirement date. The Fund is a fund of funds that invest in other JP Morgan funds and ETFs that are managed by unaffiliated investment advisers. |
| General | |
| Security Type | Mutual Fund |
| Equity Style | -- |
| Broad Asset Class | Allocation |
| Broad Category | Allocation |
| Global Peer Group | Target Maturity MA USD 2055 |
| Peer Group | Mixed-Asset Target 2055 Funds |
| Global Macro | Target Maturity |
| US Macro | Mixed-Assets Target Date Funds |
| YCharts Categorization | -- |
| YCharts Benchmark | -- |
| Prospectus Objective | Growth Funds |
| Fund Owner Firm Name | J.P. Morgan Asset Management |
| Broad Asset Class Benchmark Index | |
| ^SPXTR | 100.0% |
Net Fund Flows Versus Peer Group
1 Month
% Rank:
12
-273.03M
Peer Group Low
304.13M
Peer Group High
1 Year
% Rank:
13
140.15M
-1.046B
Peer Group Low
3.783B
Peer Group High
3 Months
% Rank:
15
-456.86M
Peer Group Low
1.100B
Peer Group High
3 Years
% Rank:
26
-976.74M
Peer Group Low
11.76B
Peer Group High
6 Months
% Rank:
15
-617.43M
Peer Group Low
2.312B
Peer Group High
5 Years
% Rank:
26
-1.359B
Peer Group Low
14.50B
Peer Group High
YTD
% Rank:
10
-548.21M
Peer Group Low
2.245B
Peer Group High
10 Years
% Rank:
24
-1.793B
Peer Group Low
19.13B
Peer Group High
Date Unavailable
Risk
Performance Versus Peer Group
Annual Total Returns Versus Peers
As of June 10, 2026.
Asset Allocation
As of April 30, 2026.
| Type | % Net |
|---|---|
| Cash | 1.16% |
| Stock | 89.85% |
| Bond | 8.38% |
| Convertible | 0.00% |
| Preferred | 0.25% |
| Other | 0.36% |
Top 10 Holdings
| Name | % Weight | Price | % Change |
|---|---|---|---|
| JPMorgan Equity Index Fund R6 | 49.18% | 110.94 | -0.25% |
| JPMorgan BetaBuilders International Equity ETF | 22.49% | 77.45 | 0.07% |
| JPMorgan BetaBuilders US Mid Cap Equity ETF | 5.52% | 121.91 | 0.50% |
| JPMorgan BetaBuilders Emerging Markets Equity ETF | 4.43% | 75.90 | -0.04% |
| JPMorgan Emerging Markets Rsrch Enh Eqty Fund R6 | 4.42% | 25.56 | 0.83% |
| JPMorgan Core Plus Bond Fund R6 | 4.31% | 7.21 | 0.28% |
| JPMorgan BetaBuilders US Small Cap Equity ETF | 2.84% | 85.86 | 0.48% |
| JPMorgan BetaBuilders MSCI US REIT ETF | 1.82% | 106.85 | 2.50% |
| JPMorgan US Government Money Market Fund IM | 1.76% | 1.00 | 0.00% |
| JPMorgan Core Bond Fund R6 | 1.43% | 10.27 | 0.29% |
Fees & Availability
| Fees | |
| Actual 12B-1 Fee | 0.50% |
| Actual Management Fee | -- |
| Administration Fee | 184.0% |
| Maximum Front Load | -- |
| Maximum Deferred Load | -- |
| Maximum Redemption Fee | -- |
| General Availability | |
| Available for Insurance Product | No |
| Available for RRSP | No |
| Purchase Details | |
| Open to New Investors |
|
| Minimum Initial Investment | 0.00 None |
| Minimum Subsequent Investment | 0.00 None |
Basic Info
| Investment Strategy | |
| The Fund seeks high total return with a shift to current income and some capital appreciation over time as it approaches and passes the target retirement date. The Fund is a fund of funds that invest in other JP Morgan funds and ETFs that are managed by unaffiliated investment advisers. |
| General | |
| Security Type | Mutual Fund |
| Equity Style | -- |
| Broad Asset Class | Allocation |
| Broad Category | Allocation |
| Global Peer Group | Target Maturity MA USD 2055 |
| Peer Group | Mixed-Asset Target 2055 Funds |
| Global Macro | Target Maturity |
| US Macro | Mixed-Assets Target Date Funds |
| YCharts Categorization | -- |
| YCharts Benchmark | -- |
| Prospectus Objective | Growth Funds |
| Fund Owner Firm Name | J.P. Morgan Asset Management |
| Broad Asset Class Benchmark Index | |
| ^SPXTR | 100.0% |
Fundamentals
| General | |
| Distribution Yield | -- |
| Dividend Yield TTM (6-8-26) | 1.78% |
| 30-Day SEC Yield | -- |
| 7-Day SEC Yield | -- |
| Number of Holdings | 15 |
| Stock | |
| Weighted Average PE Ratio | 28.63 |
| Weighted Average Price to Sales Ratio | 6.440 |
| Weighted Average Price to Book Ratio | 8.113 |
| Weighted Median ROE | 69.29% |
| Weighted Median ROA | 12.49% |
| ROI (TTM) | 18.82% |
| Return on Investment (TTM) | 18.82% |
| Earning Yield | 0.0463 |
| LT Debt / Shareholders Equity | 0.7516 |
| Number of Equity Holdings | 0 |
| Bond | |
| Yield to Maturity (4-30-26) | 5.41% |
| Effective Duration | -- |
| Average Coupon | 5.21% |
| Calculated Average Quality | 3.614 |
| Effective Maturity | 11.56 |
| Nominal Maturity | 11.79 |
| Number of Bond Holdings | 1 |
As of April 30, 2026
Growth Metrics
| EPS Growth (1Y) | 21.94% |
| EPS Growth (3Y) | 16.22% |
| EPS Growth (5Y) | 21.82% |
| Sales Growth (1Y) | 12.58% |
| Sales Growth (3Y) | 12.04% |
| Sales Growth (5Y) | 13.84% |
| Sales per Share Growth (1Y) | 29.06% |
| Sales per Share Growth (3Y) | 12.45% |
| Operating Cash Flow - Growth Rate (3Y) | 20.43% |
As of April 30, 2026
Fund Details
| Key Dates | |
| Inception Date | 7/2/2012 |
| Last Annual Report Date | 6/30/2025 |
| Last Prospectus Date | 11/1/2025 |
| Share Classes | |
| JPTBX | Inst |
| JTBBX | Retirement |
| JTTLX | Retirement |
| JTTUX | Retirement |
| JTYBX | Retirement |
| Attributes | |
| Index Fund | -- |
| Inverse Fund | No |
| Leveraged Fund | -- |
| Fund of Funds |
|
| Currency Hedged Fund | -- |
| Socially Responsible Fund | No |
Top Portfolio Holders
| Name | % Weight |
|---|---|
| Portfolio A | 5.00% |
| Portfolio B | 3.50% |
| Portfolio C | 2.25% |
Excel Add-In Codes
| Name: =YCI("M:JTRBX", "name") |
| Broad Asset Class: =YCI("M:JTRBX", "broad_asset_class") |
| Broad Category: =YCI("M:JTRBX", "broad_category_group") |
| Prospectus Objective: =YCI("M:JTRBX", "prospectus_objective") |
| To find the codes for any of our securities and financial metrics, see our Complete Excel Reference. |