

JPMorgan Strategic Income Opportunities Fund A (JSOAX)
11.39
0.00 (0.00%)
USD |
May 22 2026
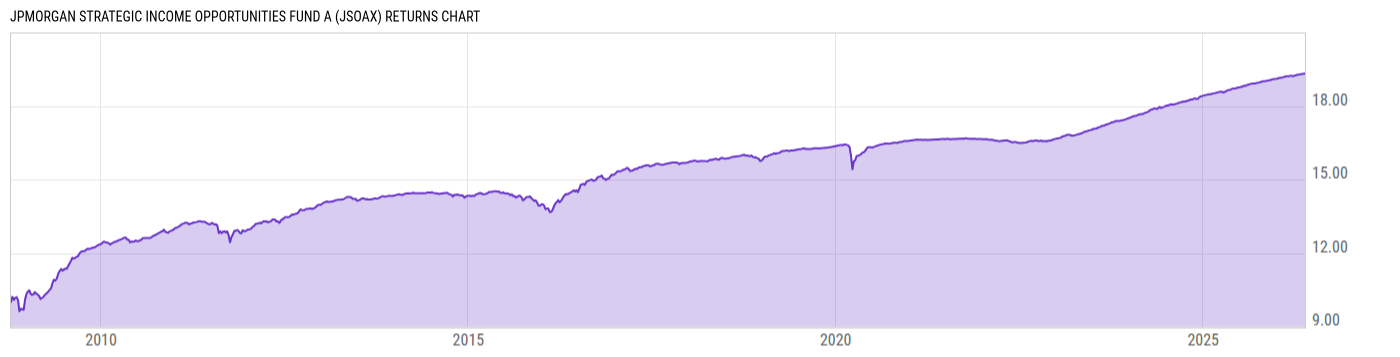
Returns Chart
Key Stats
| Net Expense Ratio | Total Assets Under Management | Weighted Average Dividend Yield | Turnover Ratio (Generic) |
|---|---|---|---|
| 0.95% | 9.304B | -- | 536.0% |
| 1 Year Fund Level Flows | 1 Year Total Returns (Daily) | Annualized Total Returns Since Inception (Daily) | Max Drawdown (Since Inception) |
| -1.310B | 3.41% |
Basic Info
| Investment Strategy | |
| The Fund seeks capital appreciation and income. The Fund may invest up to 100% of it's assets in securities that are rated below investment grade by Moody's Investor Services, Standard and Poors and/or Fitch Rating. |
| General | |
| Security Type | Mutual Fund |
| Equity Style | -- |
| Broad Asset Class | Taxable Bond |
| Broad Category | Alternative Strategies |
| Global Peer Group | Absolute Return Bond USD |
| Peer Group | Absolute Return Bond Funds |
| Global Macro | Alternative Bond |
| US Macro | Alternative Bond Funds |
| YCharts Categorization | -- |
| YCharts Benchmark | -- |
| Prospectus Objective | Absolute Return Bond Funds |
| Fund Owner Firm Name | J.P. Morgan Asset Management |
| Broad Asset Class Benchmark Index | |
| ^BBUSATR | 100.0% |
Net Fund Flows Versus Peer Group
1 Month
% Rank:
82
-407.66M
Peer Group Low
47.67M
Peer Group High
1 Year
% Rank:
98
-1.310B
-1.310B
Peer Group Low
1.364B
Peer Group High
3 Months
% Rank:
89
-462.03M
Peer Group Low
352.66M
Peer Group High
3 Years
% Rank:
98
-774.82M
Peer Group Low
4.770B
Peer Group High
6 Months
% Rank:
98
-957.59M
Peer Group Low
648.50M
Peer Group High
5 Years
% Rank:
98
-2.522B
Peer Group Low
4.930B
Peer Group High
YTD
% Rank:
89
-444.58M
Peer Group Low
582.03M
Peer Group High
10 Years
% Rank:
98
-7.151B
Peer Group Low
9.286B
Peer Group High
Date Unavailable
Risk
Performance Versus Peer Group
Annual Total Returns Versus Peers
As of May 24, 2026.
Asset Allocation
As of March 31, 2026.
| Type | % Net |
|---|---|
| Cash | 48.93% |
| Stock | 0.05% |
| Bond | 51.46% |
| Convertible | 0.00% |
| Preferred | 0.03% |
| Other | -0.47% |
Top 10 Holdings
| Name | % Weight | Price | % Change |
|---|---|---|---|
| JPMorgan Prime Money Market Fund IM | 52.85% | 1.000 | 0.00% |
| FNMA-New 6.0 05/15/2036 FIX USD Agency | 7.89% | 102.24 | -0.02% |
|
Federal National Mortgage Association 4.5% 01-APR-2056
|
3.74% | -- | -- |
| FEDERAL NATIONAL MORTGAGE ASSOCIATION FNMA-New 6.0 04/15/2033 FIX USD Agency | 2.96% | 102.24 | 0.05% |
|
Cash and Cash Equivalents
|
1.00% | -- | -- |
|
Bofa Securities Inc Repo
|
0.68% | -- | -- |
| KEURIG DR PEPPER INC. KEURDR 11/15/2026 FLT USD Corporate | 0.58% | 100.04 | 0.02% |
| Goldman Sachs Bank USA GOLDSACA 05/21/2027 FLT USD Corporate | 0.53% | 100.00 | 0.00% |
| PUBLIC STORAGE OPERATING COMPANY PUSTOR 04/16/2027 FLT USD Corporate | 0.50% | 100.20 | -0.05% |
| Oracle Corporation ORCLE 08/03/2028 FLT USD Corporate | 0.46% | 98.83 | -0.06% |
Fees & Availability
| Fees | |
| Actual 12B-1 Fee | 0.25% |
| Actual Management Fee | 0.34% |
| Administration Fee | 415.5K% |
| Maximum Front Load | 3.75% |
| Maximum Deferred Load | -- |
| Maximum Redemption Fee | -- |
| General Availability | |
| Available for Insurance Product | -- |
| Available for RRSP | -- |
| Purchase Details | |
| Open to New Investors |
|
| Minimum Initial Investment | 1000.00 None |
| Minimum Subsequent Investment | 50.00 None |
Basic Info
| Investment Strategy | |
| The Fund seeks capital appreciation and income. The Fund may invest up to 100% of it's assets in securities that are rated below investment grade by Moody's Investor Services, Standard and Poors and/or Fitch Rating. |
| General | |
| Security Type | Mutual Fund |
| Equity Style | -- |
| Broad Asset Class | Taxable Bond |
| Broad Category | Alternative Strategies |
| Global Peer Group | Absolute Return Bond USD |
| Peer Group | Absolute Return Bond Funds |
| Global Macro | Alternative Bond |
| US Macro | Alternative Bond Funds |
| YCharts Categorization | -- |
| YCharts Benchmark | -- |
| Prospectus Objective | Absolute Return Bond Funds |
| Fund Owner Firm Name | J.P. Morgan Asset Management |
| Broad Asset Class Benchmark Index | |
| ^BBUSATR | 100.0% |
Fundamentals
| General | |
| Distribution Yield | -- |
| Dividend Yield TTM (5-21-26) | 3.71% |
| 30-Day SEC Yield (4-30-26) | 2.93% |
| 7-Day SEC Yield | -- |
| Number of Holdings | 535 |
| Bond | |
| Yield to Maturity (3-31-26) | 4.42% |
| Effective Duration | 0.42 |
| Average Coupon | 4.83% |
| Calculated Average Quality | 2.361 |
| Effective Maturity | 7.781 |
| Nominal Maturity | 7.797 |
| Number of Bond Holdings | 478 |
As of March 31, 2026
Fund Details
Top Portfolio Holders
| Name | % Weight |
|---|---|
| Portfolio A | 5.00% |
| Portfolio B | 3.50% |
| Portfolio C | 2.25% |
Excel Add-In Codes
| Name: =YCI("M:JSOAX", "name") |
| Broad Asset Class: =YCI("M:JSOAX", "broad_asset_class") |
| Broad Category: =YCI("M:JSOAX", "broad_category_group") |
| Prospectus Objective: =YCI("M:JSOAX", "prospectus_objective") |
| To find the codes for any of our securities and financial metrics, see our Complete Excel Reference. |