

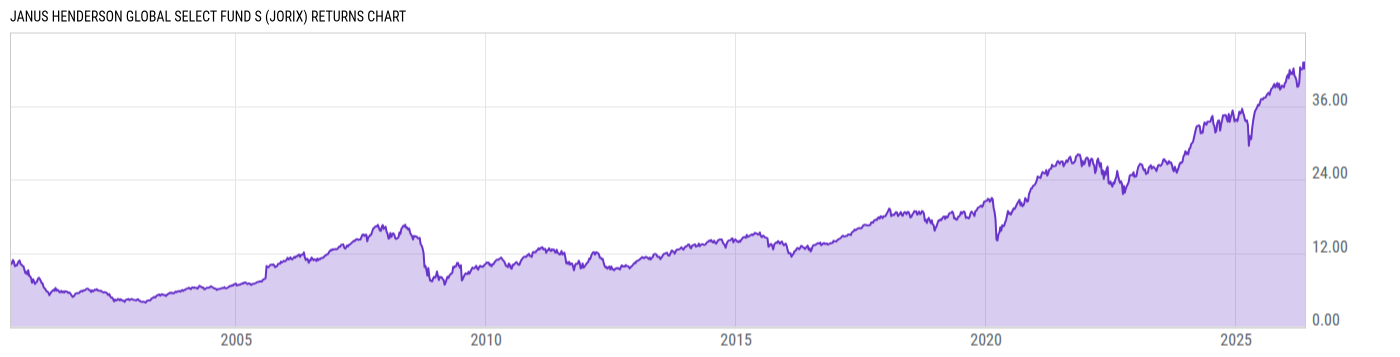
Janus Henderson Global Select Fund S (JORIX)
20.95
+0.12
(+0.58%)
USD |
Jun 09 2026
Returns Chart
Key Stats
| Net Expense Ratio | Total Assets Under Management | Weighted Average Dividend Yield | Turnover Ratio (Generic) |
|---|---|---|---|
| 1.32% | 3.279B | 1.40% | 48.00% |
| 1 Year Fund Level Flows | 1 Year Total Returns (Daily) | Annualized Total Returns Since Inception (Daily) | Max Drawdown (Since Inception) |
| -211.92M | 17.44% |
Basic Info
| Investment Strategy | |
| The Fund seeks long-term growth of capital by normally investing in a portfolio of 40-65 domestic and foreign common stocks selected for their growth potential, and at least 40% of its net assets in securities of companies that are economically tied to different countries throughout the world, excluding the United States. |
| General | |
| Security Type | Mutual Fund |
| Equity Style | Large Cap Growth |
| Broad Asset Class | International Equity |
| Broad Category | Equity |
| Global Peer Group | Equity Global |
| Peer Group | Global Large-Cap Core |
| Global Macro | Equity Global |
| US Macro | Developed Global Markets Funds |
| YCharts Categorization | -- |
| YCharts Benchmark | -- |
| Prospectus Objective | Global Funds |
| Fund Owner Firm Name | Janus Henderson Investors |
| Broad Asset Class Benchmark Index | |
| ^MSACXUSNTR | 100.0% |
Net Fund Flows Versus Peer Group
1 Month
% Rank:
72
-1.439B
Peer Group Low
143.93M
Peer Group High
1 Year
% Rank:
69
-211.92M
-12.12B
Peer Group Low
4.679B
Peer Group High
3 Months
% Rank:
74
-2.582B
Peer Group Low
1.405B
Peer Group High
3 Years
% Rank:
74
-28.33B
Peer Group Low
11.48B
Peer Group High
6 Months
% Rank:
73
-7.301B
Peer Group Low
4.870B
Peer Group High
5 Years
% Rank:
71
-36.25B
Peer Group Low
11.48B
Peer Group High
YTD
% Rank:
73
-4.525B
Peer Group Low
4.271B
Peer Group High
10 Years
% Rank:
78
-54.65B
Peer Group Low
13.12B
Peer Group High
Date Unavailable
Risk
Performance Versus Peer Group
Annual Total Returns Versus Peers
As of June 10, 2026.
Asset Allocation
As of March 31, 2026.
| Type | % Net |
|---|---|
| Cash | 0.00% |
| Stock | 97.67% |
| Bond | 0.00% |
| Convertible | 0.00% |
| Preferred | 0.00% |
| Other | 2.33% |
Top 10 Holdings
| Name | % Weight | Price | % Change |
|---|---|---|---|
| Taiwan Semiconductor Manufacturing Co., Ltd. | 6.67% | 17.24 | 0.00% |
| NVIDIA Corp. | 6.39% | 200.44 | -3.72% |
| Alphabet, Inc. | 4.57% | 356.50 | -2.13% |
| Amazon.com, Inc. | 4.32% | 237.99 | -2.54% |
| BAE Systems Plc | 4.13% | 25.68 | -1.36% |
| ConocoPhillips | 3.85% | 119.90 | 2.66% |
| Microsoft Corp. | 3.47% | 397.35 | -1.50% |
| Ferguson Enterprises, Inc. | 3.17% | 224.75 | -4.54% |
| ASML Holding NV | 3.12% | 1683.72 | -3.25% |
| Erste Group Bank AG | 2.79% | 118.59 | 0.00% |
Fees & Availability
| Fees | |
| Actual 12B-1 Fee | 0.25% |
| Actual Management Fee | -- |
| Administration Fee | -- |
| Maximum Front Load | -- |
| Maximum Deferred Load | -- |
| Maximum Redemption Fee | 0.00% |
| General Availability | |
| Available for Insurance Product | No |
| Available for RRSP | No |
| Purchase Details | |
| Open to New Investors |
|
| Minimum Initial Investment | 2500.00 None |
| Minimum Subsequent Investment | 0.00 None |
Basic Info
| Investment Strategy | |
| The Fund seeks long-term growth of capital by normally investing in a portfolio of 40-65 domestic and foreign common stocks selected for their growth potential, and at least 40% of its net assets in securities of companies that are economically tied to different countries throughout the world, excluding the United States. |
| General | |
| Security Type | Mutual Fund |
| Equity Style | Large Cap Growth |
| Broad Asset Class | International Equity |
| Broad Category | Equity |
| Global Peer Group | Equity Global |
| Peer Group | Global Large-Cap Core |
| Global Macro | Equity Global |
| US Macro | Developed Global Markets Funds |
| YCharts Categorization | -- |
| YCharts Benchmark | -- |
| Prospectus Objective | Global Funds |
| Fund Owner Firm Name | Janus Henderson Investors |
| Broad Asset Class Benchmark Index | |
| ^MSACXUSNTR | 100.0% |
Fundamentals
| General | |
| Distribution Yield | -- |
| Dividend Yield TTM (6-8-26) | 0.21% |
| 30-Day SEC Yield | -- |
| 7-Day SEC Yield | -- |
| Number of Holdings | 49 |
| Stock | |
| Weighted Average PE Ratio | 27.61 |
| Weighted Average Price to Sales Ratio | 6.580 |
| Weighted Average Price to Book Ratio | 8.227 |
| Weighted Median ROE | 30.93% |
| Weighted Median ROA | 14.00% |
| ROI (TTM) | 20.85% |
| Return on Investment (TTM) | 20.85% |
| Earning Yield | 0.0445 |
| LT Debt / Shareholders Equity | 0.5290 |
| Number of Equity Holdings | 47 |
As of March 31, 2026
Growth Metrics
| EPS Growth (1Y) | 23.64% |
| EPS Growth (3Y) | 21.91% |
| EPS Growth (5Y) | 28.01% |
| Sales Growth (1Y) | 16.46% |
| Sales Growth (3Y) | 17.64% |
| Sales Growth (5Y) | 19.81% |
| Sales per Share Growth (1Y) | 16.74% |
| Sales per Share Growth (3Y) | 18.73% |
| Operating Cash Flow - Growth Rate (3Y) | 32.66% |
As of March 31, 2026
Fund Details
| Key Dates | |
| Inception Date | 6/30/2000 |
| Last Annual Report Date | 9/30/2025 |
| Last Prospectus Date | 1/28/2026 |
| Share Classes | |
| JANRX | D |
| JORAX | A |
| JORCX | C |
| JORFX | Inst |
| JORNX | T |
| JORRX | Retirement |
| JSLNX | N |
| Attributes | |
| Index Fund | -- |
| Inverse Fund | No |
| Leveraged Fund | -- |
| Fund of Funds | No |
| Currency Hedged Fund | -- |
| Socially Responsible Fund | No |
Top Portfolio Holders
| Name | % Weight |
|---|---|
| Portfolio A | 5.00% |
| Portfolio B | 3.50% |
| Portfolio C | 2.25% |
Excel Add-In Codes
| Name: =YCI("M:JORIX", "name") |
| Broad Asset Class: =YCI("M:JORIX", "broad_asset_class") |
| Broad Category: =YCI("M:JORIX", "broad_category_group") |
| Prospectus Objective: =YCI("M:JORIX", "prospectus_objective") |
| To find the codes for any of our securities and financial metrics, see our Complete Excel Reference. |