

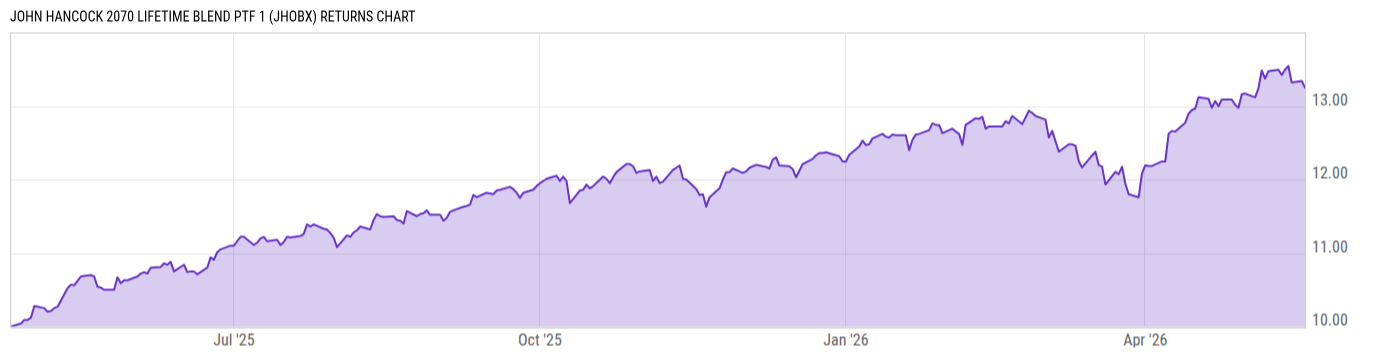
John Hancock 2070 Lifetime Blend Ptf 1 (JHOBX)
13.24
+0.01
(+0.08%)
USD |
Jun 09 2026
Returns Chart
Key Stats
| Net Expense Ratio | Total Assets Under Management | Weighted Average Dividend Yield | Turnover Ratio (Generic) |
|---|---|---|---|
| 0.36% | 7.385M | -- | -- |
| 1 Year Fund Level Flows | 1 Year Total Returns (Daily) | Annualized Total Returns Since Inception (Daily) | Max Drawdown (Since Inception) |
| 6.330M | 24.26% |
Basic Info
| Investment Strategy | |
| The Fund seeks high total return through the Fund's target retirement date, with a greater focus on income beyond the target date. The Fund is a "funds-of-funds" and invests its assets in underlying funds using an asset allocation strategy designed for investors expected to retire around the year 2070. |
| General | |
| Security Type | Mutual Fund |
| Equity Style | -- |
| Broad Asset Class | Allocation |
| Broad Category | Allocation |
| Global Peer Group | Target Maturity MA USD 2060+ |
| Peer Group | Mixed-Asset Target 2060+ Funds |
| Global Macro | Target Maturity |
| US Macro | Mixed-Assets Target Date Funds |
| YCharts Categorization | -- |
| YCharts Benchmark | -- |
| Prospectus Objective | Growth Funds |
| Fund Owner Firm Name | John Hancock Group |
| Broad Asset Class Benchmark Index | |
| ^SPXTR | 100.0% |
Net Fund Flows Versus Peer Group
1 Month
% Rank:
95
-39.17M
Peer Group Low
216.79M
Peer Group High
1 Year
% Rank:
61
6.330M
-7.726M
Peer Group Low
2.718B
Peer Group High
3 Months
% Rank:
51
-19.51M
Peer Group Low
798.19M
Peer Group High
3 Years
% Rank:
70
187376.0
Peer Group Low
6.729B
Peer Group High
6 Months
% Rank:
52
-19.82M
Peer Group Low
1.620B
Peer Group High
5 Years
% Rank:
71
187376.0
Peer Group Low
8.620B
Peer Group High
YTD
% Rank:
54
-25.54M
Peer Group Low
1.422B
Peer Group High
10 Years
% Rank:
72
187376.0
Peer Group Low
9.652B
Peer Group High
Date Unavailable
Risk
Performance Versus Peer Group
Annual Total Returns Versus Peers
As of June 10, 2026.
Asset Allocation
As of March 31, 2026.
| Type | % Net |
|---|---|
| Cash | 0.74% |
| Stock | 91.88% |
| Bond | 5.53% |
| Convertible | 0.00% |
| Preferred | 0.29% |
| Other | 1.57% |
Top 10 Holdings
| Name | % Weight | Price | % Change |
|---|---|---|---|
| John Hancock US Sector Rotation Fund NAV | 31.05% | 14.62 | 0.27% |
| John Hancock International Strat Eqty Alloc NAV | 27.04% | 13.85 | 0.29% |
| Vanguard 500 Index Fund ETF | 14.91% | 670.84 | -1.01% |
| Fidelity Mid Cap Index Fund | 11.44% | 41.17 | 0.66% |
| Vanguard Developed Markets Index Fund ETF | 4.98% | 69.23 | -0.87% |
| Fidelity Small Cap Index Fund | 3.23% | 35.92 | 0.42% |
| John Hancock Bond Fund NAV | 2.92% | 13.44 | -0.07% |
| Vanguard Emerging Markets Stock Index Fund ETF | 2.52% | 58.02 | -0.74% |
|
John Hancock Collateral Trust
|
1.89% | -- | -- |
| John Hancock Emerging Markets Debt Fund NAV | 0.58% | 8.16 | -0.24% |
Fees & Availability
| Fees | |
| Actual 12B-1 Fee | 0.05% |
| Actual Management Fee | -- |
| Administration Fee | -- |
| Maximum Front Load | -- |
| Maximum Deferred Load | -- |
| Maximum Redemption Fee | -- |
| General Availability | |
| Available for Insurance Product | No |
| Available for RRSP | No |
| Purchase Details | |
| Open to New Investors |
|
| Minimum Initial Investment | 0.00 None |
| Minimum Subsequent Investment | 0.00 None |
Basic Info
| Investment Strategy | |
| The Fund seeks high total return through the Fund's target retirement date, with a greater focus on income beyond the target date. The Fund is a "funds-of-funds" and invests its assets in underlying funds using an asset allocation strategy designed for investors expected to retire around the year 2070. |
| General | |
| Security Type | Mutual Fund |
| Equity Style | -- |
| Broad Asset Class | Allocation |
| Broad Category | Allocation |
| Global Peer Group | Target Maturity MA USD 2060+ |
| Peer Group | Mixed-Asset Target 2060+ Funds |
| Global Macro | Target Maturity |
| US Macro | Mixed-Assets Target Date Funds |
| YCharts Categorization | -- |
| YCharts Benchmark | -- |
| Prospectus Objective | Growth Funds |
| Fund Owner Firm Name | John Hancock Group |
| Broad Asset Class Benchmark Index | |
| ^SPXTR | 100.0% |
Fundamentals
| General | |
| Distribution Yield | -- |
| Dividend Yield TTM (6-8-26) | 1.30% |
| 30-Day SEC Yield | -- |
| 7-Day SEC Yield | -- |
| Number of Holdings | 17 |
| Stock | |
| Weighted Average PE Ratio | 28.00 |
| Weighted Average Price to Sales Ratio | 6.142 |
| Weighted Average Price to Book Ratio | 7.713 |
| Weighted Median ROE | 68.13% |
| Weighted Median ROA | 12.20% |
| ROI (TTM) | 21.69% |
| Return on Investment (TTM) | 21.69% |
| Earning Yield | 0.0483 |
| LT Debt / Shareholders Equity | 0.7483 |
| Number of Equity Holdings | 0 |
| Bond | |
| Yield to Maturity (3-31-26) | 5.68% |
| Effective Duration | -- |
| Average Coupon | 5.43% |
| Calculated Average Quality | 3.797 |
| Effective Maturity | 16.96 |
| Nominal Maturity | 17.48 |
| Number of Bond Holdings | 4 |
As of March 31, 2026
Growth Metrics
| EPS Growth (1Y) | 22.23% |
| EPS Growth (3Y) | 15.82% |
| EPS Growth (5Y) | 21.16% |
| Sales Growth (1Y) | 12.81% |
| Sales Growth (3Y) | 11.83% |
| Sales Growth (5Y) | 13.79% |
| Sales per Share Growth (1Y) | 28.54% |
| Sales per Share Growth (3Y) | 12.32% |
| Operating Cash Flow - Growth Rate (3Y) | 20.40% |
As of March 31, 2026
Top Portfolio Holders
| Name | % Weight |
|---|---|
| Portfolio A | 5.00% |
| Portfolio B | 3.50% |
| Portfolio C | 2.25% |
Excel Add-In Codes
| Name: =YCI("M:JHOBX", "name") |
| Broad Asset Class: =YCI("M:JHOBX", "broad_asset_class") |
| Broad Category: =YCI("M:JHOBX", "broad_category_group") |
| Prospectus Objective: =YCI("M:JHOBX", "prospectus_objective") |
| To find the codes for any of our securities and financial metrics, see our Complete Excel Reference. |