

John Hancock Bond Fund R6 (JHBSX)
13.46
-0.01
(-0.07%)
USD |
Jun 10 2026
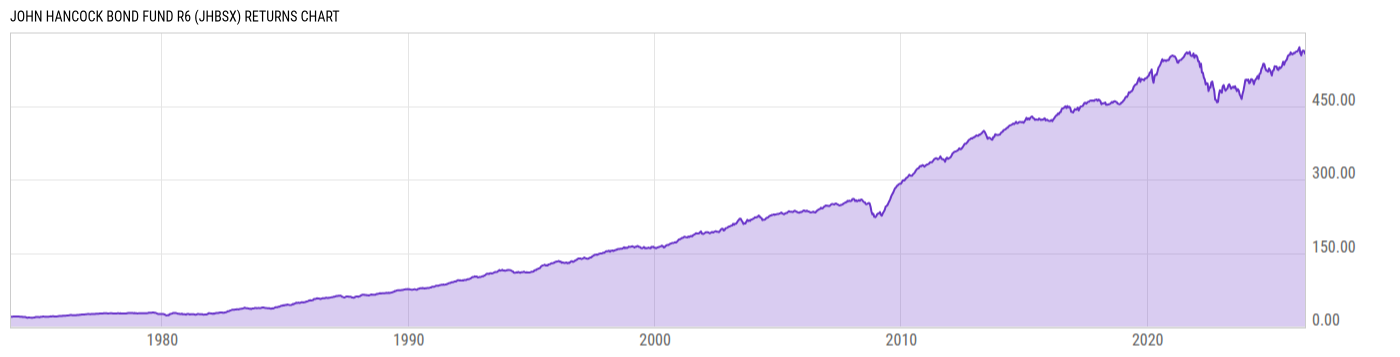
Returns Chart
Key Stats
| Net Expense Ratio | Total Assets Under Management | Weighted Average Dividend Yield | Turnover Ratio (Generic) |
|---|---|---|---|
| 0.35% | 26.42B | -- | 100.0% |
| 1 Year Fund Level Flows | 1 Year Total Returns (Daily) | Annualized Total Returns Since Inception (Daily) | Max Drawdown (Since Inception) |
| -946.80M | 5.39% |
Basic Info
| Investment Strategy | |
| The Fund seeks a high level of current income consistent with prudent investment risk. The Fund invests at least 80% of its net assets in a diversified portfolio of bonds, including corporate bonds and debentures, U.S. government and agency securities. The fund may invest up to 25% of assets in low rated high-yield bonds. |
| General | |
| Security Type | Mutual Fund |
| Equity Style | -- |
| Broad Asset Class | Taxable Bond |
| Broad Category | Fixed Income |
| Global Peer Group | Bond USD Medium Term |
| Peer Group | Core Plus Bond Funds |
| Global Macro | Bond HC |
| US Macro | Short/Intermediate Investment-Grade Funds |
| YCharts Categorization | -- |
| YCharts Benchmark | -- |
| Prospectus Objective | Core Bond Funds |
| Fund Owner Firm Name | John Hancock Group |
| Broad Asset Class Benchmark Index | |
| ^BBUSATR | 100.0% |
Net Fund Flows Versus Peer Group
1 Month
% Rank:
87
-355.03M
Peer Group Low
955.84M
Peer Group High
1 Year
% Rank:
97
-946.80M
-5.341B
Peer Group Low
5.732B
Peer Group High
3 Months
% Rank:
98
-1.705B
Peer Group Low
2.082B
Peer Group High
3 Years
% Rank:
22
-38.35B
Peer Group Low
16.67B
Peer Group High
6 Months
% Rank:
98
-3.114B
Peer Group Low
3.559B
Peer Group High
5 Years
% Rank:
19
-53.42B
Peer Group Low
16.59B
Peer Group High
YTD
% Rank:
98
-2.227B
Peer Group Low
3.045B
Peer Group High
10 Years
% Rank:
10
-55.60B
Peer Group Low
35.16B
Peer Group High
Date Unavailable
Risk
Performance Versus Peer Group
Annual Total Returns Versus Peers
As of June 11, 2026.
Asset Allocation
As of March 31, 2026.
| Type | % Net |
|---|---|
| Cash | 0.45% |
| Stock | 0.01% |
| Bond | 99.01% |
| Convertible | 0.00% |
| Preferred | 0.04% |
| Other | 0.50% |
Top 10 Holdings
| Name | % Weight | Price | % Change |
|---|---|---|---|
| United States of America USGB 4.625 11/15/2055 FIX USD Government | 1.76% | 94.89 | 1.21% |
| United States of America USGB 4.75 08/15/2055 FIX USD Government | 1.68% | 96.77 | 1.20% |
| United States of America USGB 4.125 02/15/2036 FIX USD Government | 1.62% | 97.49 | 0.73% |
| United States of America USGB 4.875 08/15/2045 FIX USD Government | 1.50% | 99.05 | 1.08% |
| United States of America USGB 1.375 08/15/2050 FIX USD Government | 1.16% | 48.87 | 1.47% |
| United States of America USGB 3.5 03/15/2029 FIX USD Government | 1.06% | 98.47 | 0.23% |
| United States of America USGB 4.75 11/15/2043 FIX USD Government | 1.06% | 98.25 | 1.10% |
| United States of America USGB 2.0 02/15/2050 FIX USD Government | 0.97% | 58.07 | 1.33% |
| United States of America USGB 1.625 11/15/2050 FIX USD Government | 0.82% | 52.10 | 1.44% |
|
John Hancock Collateral Trust
|
0.68% | -- | -- |
Fees & Availability
| Fees | |
| Actual 12B-1 Fee | -- |
| Actual Management Fee | 0.30% |
| Administration Fee | -- |
| Maximum Front Load | -- |
| Maximum Deferred Load | -- |
| Maximum Redemption Fee | -- |
| General Availability | |
| Available for Insurance Product | No |
| Available for RRSP | No |
| Purchase Details | |
| Open to New Investors |
|
| Minimum Initial Investment | 1.00M None |
| Minimum Subsequent Investment | 0.00 None |
Basic Info
| Investment Strategy | |
| The Fund seeks a high level of current income consistent with prudent investment risk. The Fund invests at least 80% of its net assets in a diversified portfolio of bonds, including corporate bonds and debentures, U.S. government and agency securities. The fund may invest up to 25% of assets in low rated high-yield bonds. |
| General | |
| Security Type | Mutual Fund |
| Equity Style | -- |
| Broad Asset Class | Taxable Bond |
| Broad Category | Fixed Income |
| Global Peer Group | Bond USD Medium Term |
| Peer Group | Core Plus Bond Funds |
| Global Macro | Bond HC |
| US Macro | Short/Intermediate Investment-Grade Funds |
| YCharts Categorization | -- |
| YCharts Benchmark | -- |
| Prospectus Objective | Core Bond Funds |
| Fund Owner Firm Name | John Hancock Group |
| Broad Asset Class Benchmark Index | |
| ^BBUSATR | 100.0% |
Fundamentals
| General | |
| Distribution Yield | -- |
| Dividend Yield TTM (6-10-26) | 4.74% |
| 30-Day SEC Yield (4-30-26) | 4.71% |
| 7-Day SEC Yield | -- |
| Number of Holdings | 1154 |
| Bond | |
| Yield to Maturity (3-31-26) | 5.31% |
| Effective Duration | 5.89 |
| Average Coupon | 4.82% |
| Calculated Average Quality | 3.251 |
| Effective Maturity | 18.39 |
| Nominal Maturity | 18.90 |
| Number of Bond Holdings | 1125 |
As of March 31, 2026
Fund Details
| Key Dates | |
| Inception Date | 11/9/1973 |
| Last Annual Report Date | 5/31/2025 |
| Last Prospectus Date | 10/1/2025 |
| Share Classes | |
| JBFRX | Retirement |
| JHBIX | Inst |
| JHCBX | C |
| JHNBX | A |
| JHRBX | Retirement |
| LP40207858 | Other |
| Attributes | |
| Index Fund | -- |
| Inverse Fund | No |
| Leveraged Fund | -- |
| Fund of Funds | No |
| Currency Hedged Fund | -- |
| Socially Responsible Fund | No |
Top Portfolio Holders
| Name | % Weight |
|---|---|
| Portfolio A | 5.00% |
| Portfolio B | 3.50% |
| Portfolio C | 2.25% |
Excel Add-In Codes
| Name: =YCI("M:JHBSX", "name") |
| Broad Asset Class: =YCI("M:JHBSX", "broad_asset_class") |
| Broad Category: =YCI("M:JHBSX", "broad_category_group") |
| Prospectus Objective: =YCI("M:JHBSX", "prospectus_objective") |
| To find the codes for any of our securities and financial metrics, see our Complete Excel Reference. |