

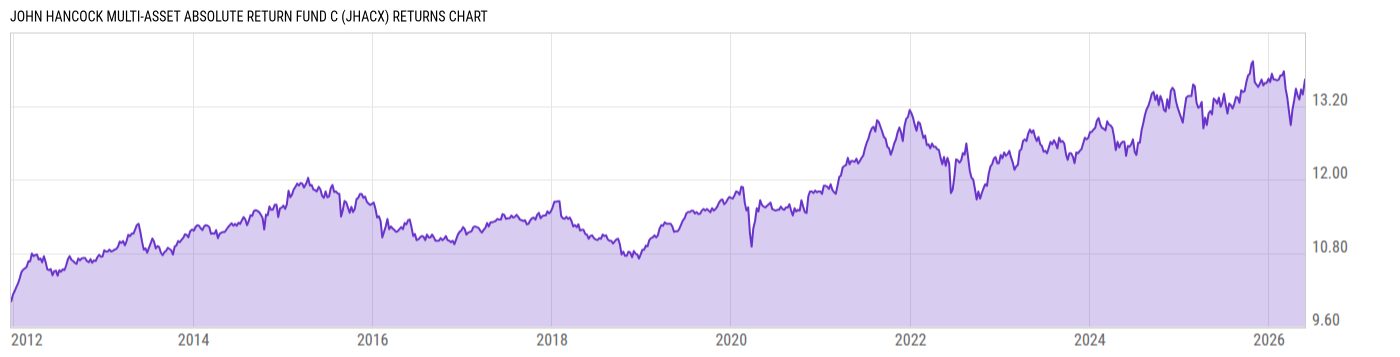
John Hancock Multi-Asset Absolute Return Fund C (JHACX)
10.10
0.00 (0.00%)
USD |
May 27 2026
Returns Chart
Key Stats
| Net Expense Ratio | Total Assets Under Management | Weighted Average Dividend Yield | Turnover Ratio (Generic) |
|---|---|---|---|
| 2.31% | 262.15M | -- | 66.00% |
| 1 Year Fund Level Flows | 1 Year Total Returns (Daily) | Annualized Total Returns Since Inception (Daily) | Max Drawdown (Since Inception) |
| 34.60M | 2.54% |
Basic Info
| Investment Strategy | |
| The Fund seeks long term total return. The Fund employs a global multi-asset strategy that aims to exploit market cyclicality and a diverse array of inefficiencies across and within global markets to maximize risk adjusted absolute return. The Find invests in a wide spectrum of equity and fixed-income securities. |
| General | |
| Security Type | Mutual Fund |
| Equity Style | -- |
| Broad Asset Class | Alternative |
| Broad Category | Alternative Strategies |
| Global Peer Group | Absolute Return USD Medium |
| Peer Group | Absolute Return Funds |
| Global Macro | Absolute Return |
| US Macro | Alternative Equity Funds |
| YCharts Categorization | -- |
| YCharts Benchmark | -- |
| Prospectus Objective | Absolute Return Funds |
| Fund Owner Firm Name | John Hancock Group |
| Broad Asset Class Benchmark Index | |
| ^MSACWINTR | 100.0% |
Net Fund Flows Versus Peer Group
1 Month
% Rank:
94
-45.60M
Peer Group Low
219.00M
Peer Group High
1 Year
% Rank:
33
34.60M
-268.05M
Peer Group Low
729.43M
Peer Group High
3 Months
% Rank:
80
-77.17M
Peer Group Low
319.68M
Peer Group High
3 Years
% Rank:
85
-2.078B
Peer Group Low
1.349B
Peer Group High
6 Months
% Rank:
31
-77.65M
Peer Group Low
404.66M
Peer Group High
5 Years
% Rank:
82
-2.545B
Peer Group Low
1.251B
Peer Group High
YTD
% Rank:
84
-42.46M
Peer Group Low
342.57M
Peer Group High
10 Years
% Rank:
98
-9.098B
Peer Group Low
3.180B
Peer Group High
Date Unavailable
Risk
Performance Versus Peer Group
Annual Total Returns Versus Peers
As of May 28, 2026.
Asset Allocation
As of March 31, 2026.
| Type | % Net |
|---|---|
| Cash | 1.81% |
| Stock | 69.86% |
| Bond | 24.45% |
| Convertible | 0.00% |
| Preferred | 0.00% |
| Other | 3.88% |
Top 10 Holdings
| Name | % Weight | Price | % Change |
|---|---|---|---|
| United States of America USGB 4.5 02/15/2036 FIX USD Government | 4.27% | 100.78 | 0.07% |
| United States of America USGB 4.0 02/15/2034 FIX USD Government | 3.82% | 97.60 | 0.06% |
|
Other Assets less Liabilities
|
3.78% | -- | -- |
| United States of America USGB 4.5 11/15/2033 FIX USD Government | 3.07% | 100.93 | 0.05% |
| United States of America USGB 4.125 11/15/2032 FIX USD Government | 2.46% | 99.07 | 0.04% |
| United States of America USGB 3.875 08/15/2034 FIX USD Government | 2.26% | 96.40 | 0.06% |
| Microsoft Corp. | 2.23% | 412.67 | -0.81% |
| The Coca-Cola Co. | 2.09% | 81.62 | 1.44% |
| United States of America USGB 4.25 11/15/2034 FIX USD Government | 1.94% | 98.82 | 0.05% |
| VINCI SA | 1.62% | 144.16 | 0.00% |
Fees & Availability
| Fees | |
| Actual 12B-1 Fee | 1.00% |
| Actual Management Fee | 1.03% |
| Administration Fee | -- |
| Maximum Front Load | -- |
| Maximum Deferred Load | 1.00% |
| Maximum Redemption Fee | -- |
| General Availability | |
| Available for Insurance Product | No |
| Available for RRSP | No |
| Purchase Details | |
| Open to New Investors |
|
| Minimum Initial Investment | 1000.00 None |
| Minimum Subsequent Investment | 0.00 None |
Basic Info
| Investment Strategy | |
| The Fund seeks long term total return. The Fund employs a global multi-asset strategy that aims to exploit market cyclicality and a diverse array of inefficiencies across and within global markets to maximize risk adjusted absolute return. The Find invests in a wide spectrum of equity and fixed-income securities. |
| General | |
| Security Type | Mutual Fund |
| Equity Style | -- |
| Broad Asset Class | Alternative |
| Broad Category | Alternative Strategies |
| Global Peer Group | Absolute Return USD Medium |
| Peer Group | Absolute Return Funds |
| Global Macro | Absolute Return |
| US Macro | Alternative Equity Funds |
| YCharts Categorization | -- |
| YCharts Benchmark | -- |
| Prospectus Objective | Absolute Return Funds |
| Fund Owner Firm Name | John Hancock Group |
| Broad Asset Class Benchmark Index | |
| ^MSACWINTR | 100.0% |
Fundamentals
| General | |
| Distribution Yield | -- |
| Dividend Yield TTM (5-26-26) | 0.86% |
| 30-Day SEC Yield | -- |
| 7-Day SEC Yield | -- |
| Number of Holdings | 202 |
| Stock | |
| Weighted Average PE Ratio | 27.08 |
| Weighted Average Price to Sales Ratio | 5.283 |
| Weighted Average Price to Book Ratio | 7.933 |
| Weighted Median ROE | 35.08% |
| Weighted Median ROA | 11.33% |
| ROI (TTM) | 17.51% |
| Return on Investment (TTM) | 17.51% |
| Earning Yield | 0.0471 |
| LT Debt / Shareholders Equity | 0.9438 |
| Number of Equity Holdings | 180 |
| Bond | |
| Yield to Maturity (3-31-26) | 4.22% |
| Effective Duration | -- |
| Average Coupon | 4.13% |
| Calculated Average Quality | 2.00 |
| Effective Maturity | 8.298 |
| Nominal Maturity | 8.298 |
| Number of Bond Holdings | 12 |
As of March 31, 2026
Growth Metrics
| EPS Growth (1Y) | 23.75% |
| EPS Growth (3Y) | 17.39% |
| EPS Growth (5Y) | 17.71% |
| Sales Growth (1Y) | 10.57% |
| Sales Growth (3Y) | 8.45% |
| Sales Growth (5Y) | 10.82% |
| Sales per Share Growth (1Y) | 12.12% |
| Sales per Share Growth (3Y) | 9.83% |
| Operating Cash Flow - Growth Rate (3Y) | 16.17% |
As of March 31, 2026
Fund Details
| Key Dates | |
| Inception Date | 8/1/2012 |
| Last Annual Report Date | 7/31/2025 |
| Last Prospectus Date | 1/1/2026 |
| Share Classes | |
| JHAAX | A |
| JHAIX | Inst |
| JHARX | Retirement |
| JHASX | Retirement |
| LP40194685 | Other |
| Attributes | |
| Index Fund | -- |
| Inverse Fund | No |
| Leveraged Fund | -- |
| Fund of Funds | No |
| Currency Hedged Fund | -- |
| Socially Responsible Fund | No |
Top Portfolio Holders
| Name | % Weight |
|---|---|
| Portfolio A | 5.00% |
| Portfolio B | 3.50% |
| Portfolio C | 2.25% |
Excel Add-In Codes
| Name: =YCI("M:JHACX", "name") |
| Broad Asset Class: =YCI("M:JHACX", "broad_asset_class") |
| Broad Category: =YCI("M:JHACX", "broad_category_group") |
| Prospectus Objective: =YCI("M:JHACX", "prospectus_objective") |
| To find the codes for any of our securities and financial metrics, see our Complete Excel Reference. |