

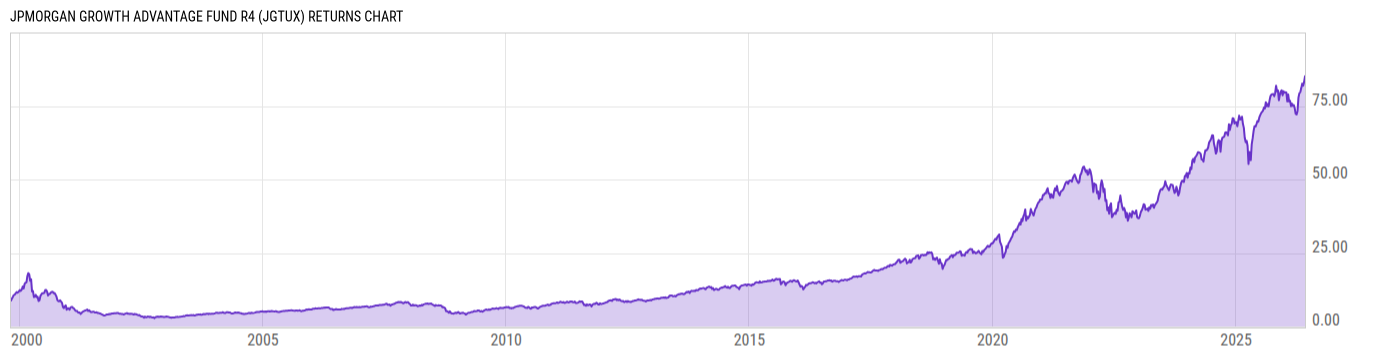
JPMorgan Growth Advantage Fund R4 (JGTUX)
45.10
+0.01
(+0.02%)
USD |
Jun 02 2026
Returns Chart
Key Stats
| Net Expense Ratio | Total Assets Under Management | Weighted Average Dividend Yield | Turnover Ratio (Generic) |
|---|---|---|---|
| 0.75% | 23.05B | 0.50% | 36.00% |
| 1 Year Fund Level Flows | 1 Year Total Returns (Daily) | Annualized Total Returns Since Inception (Daily) | Max Drawdown (Since Inception) |
| -2.751B | 24.43% |
Basic Info
| Investment Strategy | |
| The Fund seeks to provide long-term capital growth. It will invest primarily in common stocks of companies across all market capitalizations. At any given time, it may invest a significant portion of its assets in companies of one particular market capitalization category, such as large capitalization companies. |
| General | |
| Security Type | Mutual Fund |
| Equity Style | Large Cap Growth |
| Broad Asset Class | US Equity |
| Broad Category | Equity |
| Global Peer Group | Equity US |
| Peer Group | Large-Cap Growth Funds |
| Global Macro | Equity North America |
| US Macro | Large-Cap Funds |
| YCharts Categorization | -- |
| YCharts Benchmark | -- |
| Prospectus Objective | Growth Funds |
| Fund Owner Firm Name | J.P. Morgan Asset Management |
| Broad Asset Class Benchmark Index | |
| ^SPXTR | 100.0% |
Net Fund Flows Versus Peer Group
1 Month
% Rank:
93
-3.775B
Peer Group Low
7.082B
Peer Group High
1 Year
% Rank:
89
-2.751B
-21.36B
Peer Group Low
23.25B
Peer Group High
3 Months
% Rank:
91
-4.868B
Peer Group Low
12.78B
Peer Group High
3 Years
% Rank:
83
-57.75B
Peer Group Low
59.92B
Peer Group High
6 Months
% Rank:
93
-11.51B
Peer Group Low
11.90B
Peer Group High
5 Years
% Rank:
76
-79.88B
Peer Group Low
81.23B
Peer Group High
YTD
% Rank:
93
-6.466B
Peer Group Low
11.19B
Peer Group High
10 Years
% Rank:
80
-130.46B
Peer Group Low
108.25B
Peer Group High
Date Unavailable
Risk
Performance Versus Peer Group
Annual Total Returns Versus Peers
As of June 03, 2026.
Asset Allocation
As of March 31, 2026.
| Type | % Net |
|---|---|
| Cash | 1.02% |
| Stock | 98.70% |
| Bond | 0.12% |
| Convertible | 0.00% |
| Preferred | 0.18% |
| Other | -0.02% |
Top 10 Holdings
| Name | % Weight | Price | % Change |
|---|---|---|---|
| NVIDIA Corp. | 11.76% | 216.87 | -2.67% |
| Apple, Inc. | 7.77% | 311.59 | -1.15% |
| Alphabet, Inc. | 6.86% | 356.26 | -0.59% |
| Broadcom Inc. | 5.83% | 484.23 | 0.55% |
| Microsoft Corp. | 5.16% | 427.03 | -3.24% |
| Amazon.com, Inc. | 5.11% | 249.98 | -2.55% |
| Meta Platforms, Inc. | 3.64% | 613.02 | 2.58% |
| Tesla, Inc. | 2.93% | 423.71 | -0.01% |
| Netflix, Inc. | 1.69% | 81.42 | -2.29% |
| Mastercard, Inc. | 1.58% | 467.33 | -2.17% |
Fees & Availability
| Fees | |
| Actual 12B-1 Fee | -- |
| Actual Management Fee | 0.39% |
| Administration Fee | 14.08K% |
| Maximum Front Load | -- |
| Maximum Deferred Load | -- |
| Maximum Redemption Fee | -- |
| General Availability | |
| Available for Insurance Product | No |
| Available for RRSP | No |
| Purchase Details | |
| Open to New Investors |
|
| Minimum Initial Investment | 0.00 None |
| Minimum Subsequent Investment | 0.00 None |
Basic Info
| Investment Strategy | |
| The Fund seeks to provide long-term capital growth. It will invest primarily in common stocks of companies across all market capitalizations. At any given time, it may invest a significant portion of its assets in companies of one particular market capitalization category, such as large capitalization companies. |
| General | |
| Security Type | Mutual Fund |
| Equity Style | Large Cap Growth |
| Broad Asset Class | US Equity |
| Broad Category | Equity |
| Global Peer Group | Equity US |
| Peer Group | Large-Cap Growth Funds |
| Global Macro | Equity North America |
| US Macro | Large-Cap Funds |
| YCharts Categorization | -- |
| YCharts Benchmark | -- |
| Prospectus Objective | Growth Funds |
| Fund Owner Firm Name | J.P. Morgan Asset Management |
| Broad Asset Class Benchmark Index | |
| ^SPXTR | 100.0% |
Fundamentals
| General | |
| Distribution Yield | -- |
| Dividend Yield TTM (6-1-26) | 0.09% |
| 30-Day SEC Yield | -- |
| 7-Day SEC Yield | -- |
| Number of Holdings | 85 |
| Stock | |
| Weighted Average PE Ratio | 36.17 |
| Weighted Average Price to Sales Ratio | 10.16 |
| Weighted Average Price to Book Ratio | 14.12 |
| Weighted Median ROE | 47.49% |
| Weighted Median ROA | 20.35% |
| ROI (TTM) | 27.73% |
| Return on Investment (TTM) | 27.73% |
| Earning Yield | 0.0315 |
| LT Debt / Shareholders Equity | 0.6526 |
| Number of Equity Holdings | 83 |
As of March 31, 2026
Growth Metrics
| EPS Growth (1Y) | 28.64% |
| EPS Growth (3Y) | 29.09% |
| EPS Growth (5Y) | 36.18% |
| Sales Growth (1Y) | 20.87% |
| Sales Growth (3Y) | 23.19% |
| Sales Growth (5Y) | 22.40% |
| Sales per Share Growth (1Y) | 20.62% |
| Sales per Share Growth (3Y) | 23.31% |
| Operating Cash Flow - Growth Rate (3Y) | 39.78% |
As of March 31, 2026
Fund Details
| Key Dates | |
| Inception Date | 5/31/2017 |
| Last Annual Report Date | 6/30/2025 |
| Last Prospectus Date | 11/1/2025 |
| Share Classes | |
| JGACX | C |
| JGASX | Inst |
| JGRJX | Retirement |
| JGTTX | Retirement |
| JGVRX | Retirement |
| JGVVX | Retirement |
| VHIAX | A |
| Attributes | |
| Index Fund | -- |
| Inverse Fund | No |
| Leveraged Fund | -- |
| Fund of Funds | No |
| Currency Hedged Fund | -- |
| Socially Responsible Fund | No |
Top Portfolio Holders
| Name | % Weight |
|---|---|
| Portfolio A | 5.00% |
| Portfolio B | 3.50% |
| Portfolio C | 2.25% |
Excel Add-In Codes
| Name: =YCI("M:JGTUX", "name") |
| Broad Asset Class: =YCI("M:JGTUX", "broad_asset_class") |
| Broad Category: =YCI("M:JGTUX", "broad_category_group") |
| Prospectus Objective: =YCI("M:JGTUX", "prospectus_objective") |
| To find the codes for any of our securities and financial metrics, see our Complete Excel Reference. |