

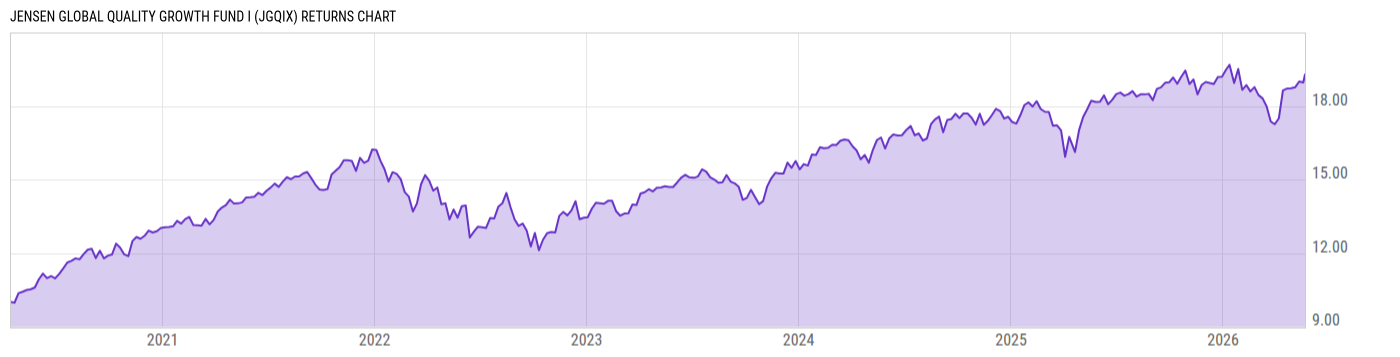
Jensen Global Quality Growth Fund I (JGQIX)
18.93
+0.10
(+0.53%)
USD |
Jun 09 2026
Returns Chart
Key Stats
| Net Expense Ratio | Total Assets Under Management | Weighted Average Dividend Yield | Turnover Ratio (Generic) |
|---|---|---|---|
| 1.02% | 75.38M | 0.88% | 23.00% |
| 1 Year Fund Level Flows | 1 Year Total Returns (Daily) | Annualized Total Returns Since Inception (Daily) | Max Drawdown (Since Inception) |
| 5.834M | 6.30% |
Basic Info
| Investment Strategy | |
| The Fund seeks long-term capital appreciation. The Fund invests in equity securities of companies that have produced long-term records of persistently high returns on shareholder equity, companies that has market capitalization of $1 billion or more, and a return on equity of 15% or greater in each of the last 10 years. |
| General | |
| Security Type | Mutual Fund |
| Equity Style | Large Cap Growth |
| Broad Asset Class | International Equity |
| Broad Category | Equity |
| Global Peer Group | Equity Global |
| Peer Group | Global Large-Cap Core |
| Global Macro | Equity Global |
| US Macro | Developed Global Markets Funds |
| YCharts Categorization | -- |
| YCharts Benchmark | -- |
| Prospectus Objective | Global Funds |
| Fund Owner Firm Name | Jensen Investment Management |
| Broad Asset Class Benchmark Index | |
| ^MSACXUSNTR | 100.0% |
Net Fund Flows Versus Peer Group
1 Month
% Rank:
38
-1.439B
Peer Group Low
143.93M
Peer Group High
1 Year
% Rank:
31
5.834M
-12.12B
Peer Group Low
4.679B
Peer Group High
3 Months
% Rank:
41
-2.582B
Peer Group Low
1.405B
Peer Group High
3 Years
% Rank:
34
-28.33B
Peer Group Low
11.48B
Peer Group High
6 Months
% Rank:
40
-7.301B
Peer Group Low
4.870B
Peer Group High
5 Years
% Rank:
34
-36.25B
Peer Group Low
11.48B
Peer Group High
YTD
% Rank:
41
-4.525B
Peer Group Low
4.271B
Peer Group High
10 Years
% Rank:
34
-54.65B
Peer Group Low
13.12B
Peer Group High
Date Unavailable
Risk
Performance Versus Peer Group
Annual Total Returns Versus Peers
As of June 09, 2026.
Asset Allocation
As of March 31, 2026.
| Type | % Net |
|---|---|
| Cash | 0.50% |
| Stock | 99.11% |
| Bond | 0.40% |
| Convertible | 0.00% |
| Preferred | 0.00% |
| Other | -0.01% |
Top 10 Holdings
| Name | % Weight | Price | % Change |
|---|---|---|---|
| Taiwan Semiconductor Manufacturing Co., Ltd. | 8.00% | 427.87 | 0.25% |
| Microsoft Corp. | 6.61% | 403.39 | -2.03% |
| Alphabet, Inc. | 5.96% | 363.98 | 0.18% |
| Amazon.com, Inc. | 4.93% | 244.18 | -0.42% |
| ASML Holding NV | 4.88% | 1740.32 | 7.36% |
| KLA Corp. | 4.84% | 2140.12 | 1.52% |
| NVIDIA Corp. | 4.83% | 208.16 | -0.23% |
| Aon Plc | 4.54% | 331.54 | 1.75% |
| AstraZeneca PLC | 4.47% | 183.29 | 0.96% |
| Apple, Inc. | 4.10% | 290.49 | -3.66% |
Fees & Availability
| Fees | |
| Actual 12B-1 Fee | 0.02% |
| Actual Management Fee | 0.53% |
| Administration Fee | 1.79K% |
| Maximum Front Load | -- |
| Maximum Deferred Load | -- |
| Maximum Redemption Fee | -- |
| General Availability | |
| Available for Insurance Product | No |
| Available for RRSP | No |
| Purchase Details | |
| Open to New Investors |
|
| Minimum Initial Investment | 250000.0 None |
| Minimum Subsequent Investment | 100.00 None |
Basic Info
| Investment Strategy | |
| The Fund seeks long-term capital appreciation. The Fund invests in equity securities of companies that have produced long-term records of persistently high returns on shareholder equity, companies that has market capitalization of $1 billion or more, and a return on equity of 15% or greater in each of the last 10 years. |
| General | |
| Security Type | Mutual Fund |
| Equity Style | Large Cap Growth |
| Broad Asset Class | International Equity |
| Broad Category | Equity |
| Global Peer Group | Equity Global |
| Peer Group | Global Large-Cap Core |
| Global Macro | Equity Global |
| US Macro | Developed Global Markets Funds |
| YCharts Categorization | -- |
| YCharts Benchmark | -- |
| Prospectus Objective | Global Funds |
| Fund Owner Firm Name | Jensen Investment Management |
| Broad Asset Class Benchmark Index | |
| ^MSACXUSNTR | 100.0% |
Fundamentals
| General | |
| Distribution Yield | -- |
| Dividend Yield TTM (6-8-26) | 0.19% |
| 30-Day SEC Yield | -- |
| 7-Day SEC Yield | -- |
| Number of Holdings | 33 |
| Stock | |
| Weighted Average PE Ratio | 30.00 |
| Weighted Average Price to Sales Ratio | 8.412 |
| Weighted Average Price to Book Ratio | 11.82 |
| Weighted Median ROE | 52.16% |
| Weighted Median ROA | 19.94% |
| ROI (TTM) | 27.20% |
| Return on Investment (TTM) | 27.20% |
| Earning Yield | 0.0359 |
| LT Debt / Shareholders Equity | 0.6590 |
| Number of Equity Holdings | 31 |
As of March 31, 2026
Growth Metrics
| EPS Growth (1Y) | 30.29% |
| EPS Growth (3Y) | 23.92% |
| EPS Growth (5Y) | 26.21% |
| Sales Growth (1Y) | 17.92% |
| Sales Growth (3Y) | 15.72% |
| Sales Growth (5Y) | 17.06% |
| Sales per Share Growth (1Y) | 18.61% |
| Sales per Share Growth (3Y) | 16.55% |
| Operating Cash Flow - Growth Rate (3Y) | 22.87% |
As of March 31, 2026
Fund Details
Top Portfolio Holders
| Name | % Weight |
|---|---|
| Portfolio A | 5.00% |
| Portfolio B | 3.50% |
| Portfolio C | 2.25% |
Excel Add-In Codes
| Name: =YCI("M:JGQIX", "name") |
| Broad Asset Class: =YCI("M:JGQIX", "broad_asset_class") |
| Broad Category: =YCI("M:JGQIX", "broad_category_group") |
| Prospectus Objective: =YCI("M:JGQIX", "prospectus_objective") |
| To find the codes for any of our securities and financial metrics, see our Complete Excel Reference. |