

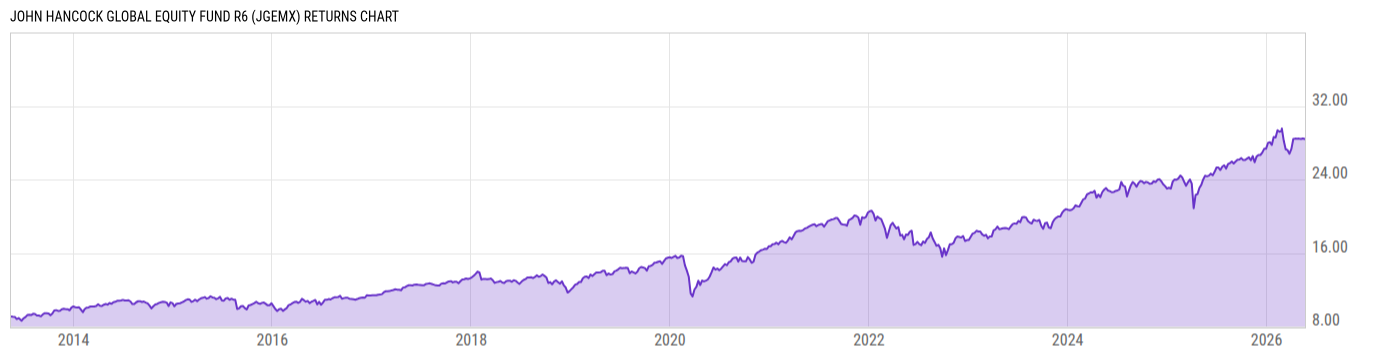
John Hancock Global Equity Fund R6 (JGEMX)
13.24
+0.09
(+0.68%)
USD |
Jun 09 2026
Returns Chart
Key Stats
| Net Expense Ratio | Total Assets Under Management | Weighted Average Dividend Yield | Turnover Ratio (Generic) |
|---|---|---|---|
| 0.88% | 1.126B | 1.85% | 64.00% |
| 1 Year Fund Level Flows | 1 Year Total Returns (Daily) | Annualized Total Returns Since Inception (Daily) | Max Drawdown (Since Inception) |
| 256.55M | 15.41% |
Basic Info
| Investment Strategy | |
| The Fund seeks long-term capital appreciation. The Fund invests at least 80% of net assets in a diversified portfolio of equity securities. The sub advisor aims to create a diversified portfolio of quality global stocks of any size that not only demonstrate compelling value but also generate sustainable cash flows. |
| General | |
| Security Type | Mutual Fund |
| Equity Style | Large Cap Value |
| Broad Asset Class | International Equity |
| Broad Category | Equity |
| Global Peer Group | Equity Global |
| Peer Group | Global Large-Cap Value |
| Global Macro | Equity Global |
| US Macro | Developed Global Markets Funds |
| YCharts Categorization | -- |
| YCharts Benchmark | -- |
| Prospectus Objective | Global Funds |
| Fund Owner Firm Name | John Hancock Group |
| Broad Asset Class Benchmark Index | |
| ^MSACXUSNTR | 100.0% |
Net Fund Flows Versus Peer Group
1 Month
% Rank:
10
-117.52M
Peer Group Low
95.38M
Peer Group High
1 Year
% Rank:
7
256.55M
-1.447B
Peer Group Low
1.488B
Peer Group High
3 Months
% Rank:
7
-1.097B
Peer Group Low
432.80M
Peer Group High
3 Years
% Rank:
14
-3.349B
Peer Group Low
1.730B
Peer Group High
6 Months
% Rank:
7
-1.372B
Peer Group Low
1.040B
Peer Group High
5 Years
% Rank:
27
-5.438B
Peer Group Low
1.730B
Peer Group High
YTD
% Rank:
8
-1.327B
Peer Group Low
974.58M
Peer Group High
10 Years
% Rank:
32
-23.54B
Peer Group Low
2.135B
Peer Group High
Date Unavailable
Risk
Performance Versus Peer Group
Annual Total Returns Versus Peers
As of June 10, 2026.
Asset Allocation
As of March 31, 2026.
| Type | % Net |
|---|---|
| Cash | 1.27% |
| Stock | 95.73% |
| Bond | 0.88% |
| Convertible | 0.00% |
| Preferred | 2.50% |
| Other | -0.38% |
Top 10 Holdings
| Name | % Weight | Price | % Change |
|---|---|---|---|
| CRH Plc | 2.46% | 103.70 | 2.14% |
| Taiwan Semiconductor Manufacturing Co., Ltd. | 2.29% | 17.24 | 0.00% |
| Microsoft Corp. | 2.26% | 403.41 | -2.02% |
| Medtronic Plc | 2.20% | 81.98 | 1.60% |
| JPMorgan US Treasury Plus Money Market Fund Inst | 2.15% | 1.00 | 0.00% |
| American Electric Power Co., Inc. | 2.10% | 127.76 | 0.78% |
| International Flavors & Fragrances, Inc. | 2.09% | 75.78 | 4.38% |
| Anheuser-Busch InBev NV | 2.08% | 77.57 | 0.00% |
| National Grid Plc | 2.06% | 16.25 | 3.97% |
| Chubb Ltd. | 2.04% | 325.13 | 1.01% |
Fees & Availability
| Fees | |
| Actual 12B-1 Fee | -- |
| Actual Management Fee | 0.79% |
| Administration Fee | -- |
| Maximum Front Load | -- |
| Maximum Deferred Load | -- |
| Maximum Redemption Fee | -- |
| General Availability | |
| Available for Insurance Product | No |
| Available for RRSP | No |
| Purchase Details | |
| Open to New Investors |
|
| Minimum Initial Investment | 1.00M None |
| Minimum Subsequent Investment | 0.00 None |
Basic Info
| Investment Strategy | |
| The Fund seeks long-term capital appreciation. The Fund invests at least 80% of net assets in a diversified portfolio of equity securities. The sub advisor aims to create a diversified portfolio of quality global stocks of any size that not only demonstrate compelling value but also generate sustainable cash flows. |
| General | |
| Security Type | Mutual Fund |
| Equity Style | Large Cap Value |
| Broad Asset Class | International Equity |
| Broad Category | Equity |
| Global Peer Group | Equity Global |
| Peer Group | Global Large-Cap Value |
| Global Macro | Equity Global |
| US Macro | Developed Global Markets Funds |
| YCharts Categorization | -- |
| YCharts Benchmark | -- |
| Prospectus Objective | Global Funds |
| Fund Owner Firm Name | John Hancock Group |
| Broad Asset Class Benchmark Index | |
| ^MSACXUSNTR | 100.0% |
Fundamentals
| General | |
| Distribution Yield | -- |
| Dividend Yield TTM (6-8-26) | 1.28% |
| 30-Day SEC Yield | -- |
| 7-Day SEC Yield | -- |
| Number of Holdings | 69 |
| Stock | |
| Weighted Average PE Ratio | 21.98 |
| Weighted Average Price to Sales Ratio | 3.500 |
| Weighted Average Price to Book Ratio | 3.471 |
| Weighted Median ROE | 16.15% |
| Weighted Median ROA | 6.22% |
| ROI (TTM) | 10.42% |
| Return on Investment (TTM) | 10.42% |
| Earning Yield | 0.0542 |
| LT Debt / Shareholders Equity | 0.6989 |
| Number of Equity Holdings | 65 |
As of March 31, 2026
Growth Metrics
| EPS Growth (1Y) | 23.97% |
| EPS Growth (3Y) | 9.99% |
| EPS Growth (5Y) | 13.87% |
| Sales Growth (1Y) | 8.23% |
| Sales Growth (3Y) | 4.84% |
| Sales Growth (5Y) | 8.32% |
| Sales per Share Growth (1Y) | 8.34% |
| Sales per Share Growth (3Y) | 5.68% |
| Operating Cash Flow - Growth Rate (3Y) | 8.37% |
As of March 31, 2026
Fund Details
| Key Dates | |
| Inception Date | 3/27/2015 |
| Last Annual Report Date | 8/31/2025 |
| Last Prospectus Date | 1/1/2026 |
| Share Classes | |
| JGECX | C |
| JGEFX | Inst |
| JGERX | Retirement |
| JGETX | Retirement |
| JHGEX | A |
| LP40203136 | Other |
| Attributes | |
| Index Fund | -- |
| Inverse Fund | No |
| Leveraged Fund | -- |
| Fund of Funds | No |
| Currency Hedged Fund | -- |
| Socially Responsible Fund | No |
Top Portfolio Holders
| Name | % Weight |
|---|---|
| Portfolio A | 5.00% |
| Portfolio B | 3.50% |
| Portfolio C | 2.25% |
Excel Add-In Codes
| Name: =YCI("M:JGEMX", "name") |
| Broad Asset Class: =YCI("M:JGEMX", "broad_asset_class") |
| Broad Category: =YCI("M:JGEMX", "broad_category_group") |
| Prospectus Objective: =YCI("M:JGEMX", "prospectus_objective") |
| To find the codes for any of our securities and financial metrics, see our Complete Excel Reference. |